Fig. 10
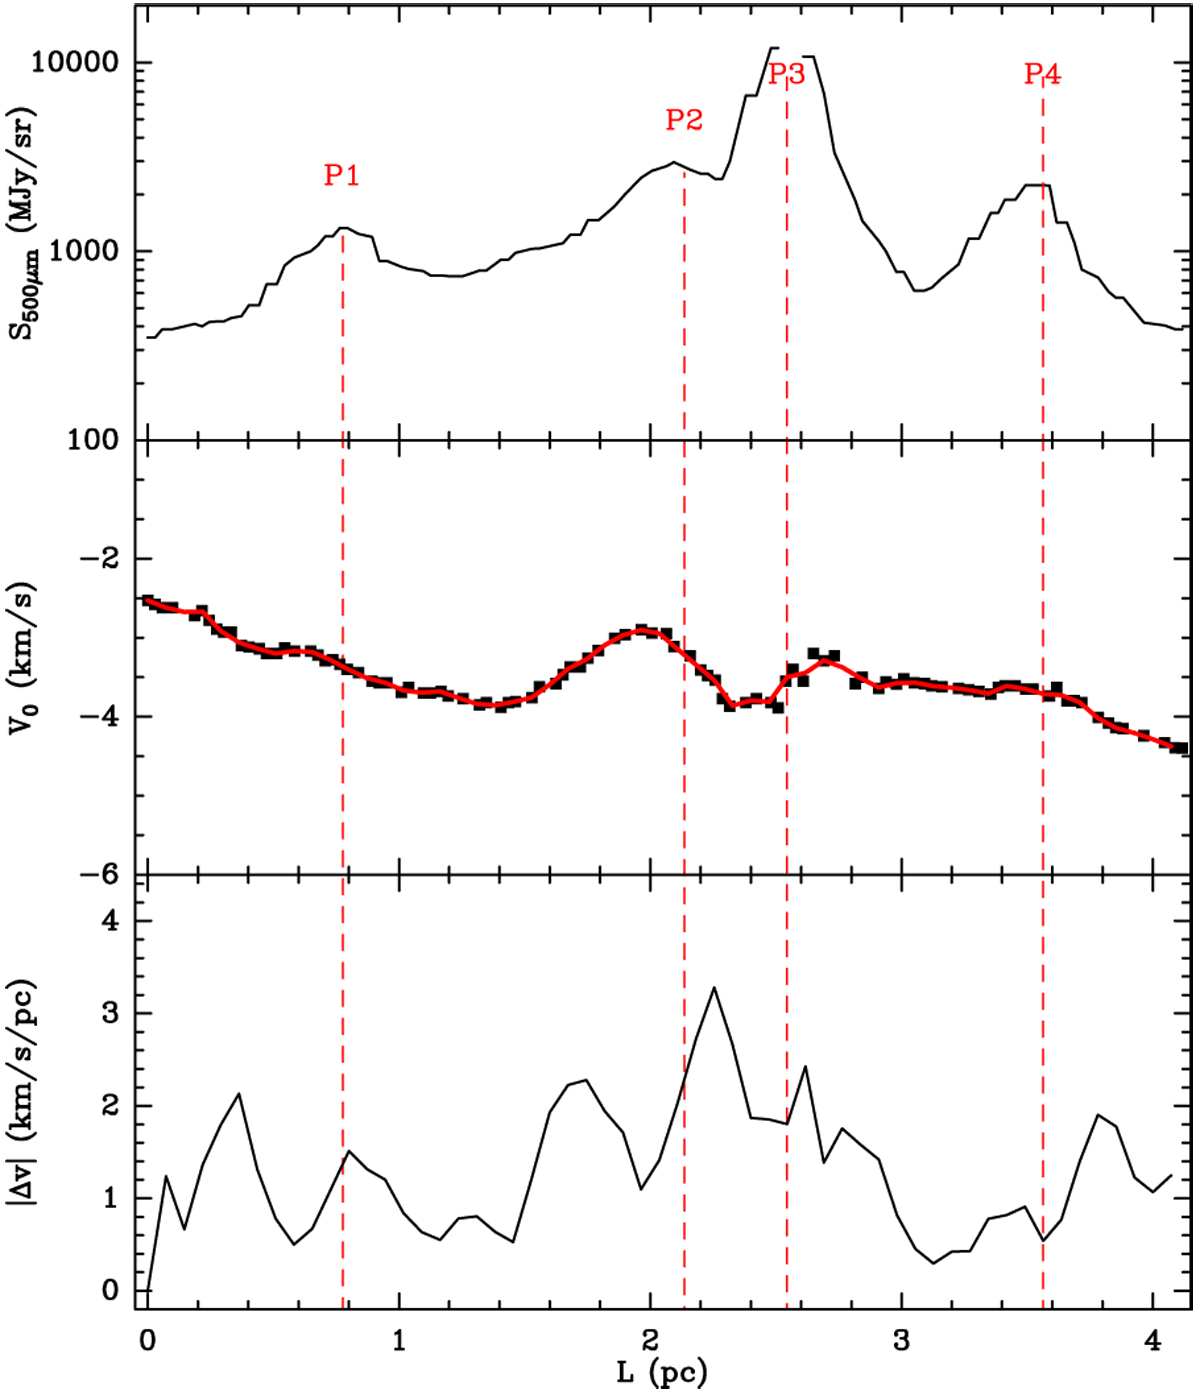
Top panel: distribution of dust brightness from the Hi-GAL-500 μm map (with 36′′ resolution, comparable with that of the line data) as a function of position along the main spine of G351. The starting point for the skeleton is the position α(J2000) = 17h 26m17.′′2, δ(J2000) = −36°02′56.′′7. Labels P1–P4 denote the four peaks detected in the Herschel 500 μm dust brightness and correspond to Clump-5, Clump-2, Clump-1, and Clump-3, respectively. Middle panel: velocity centroid for C18O (2–1) as a function of position along the skeleton of G351. The black squares represent the data points, the red curve obtained by resampling the data over a bin of 15′′ (equivalent to 0.07 pc). Botton panel: absolute velocity gradient along the spine computed over 0.07 pc.
Current usage metrics show cumulative count of Article Views (full-text article views including HTML views, PDF and ePub downloads, according to the available data) and Abstracts Views on Vision4Press platform.
Data correspond to usage on the plateform after 2015. The current usage metrics is available 48-96 hours after online publication and is updated daily on week days.
Initial download of the metrics may take a while.