Fig. 1

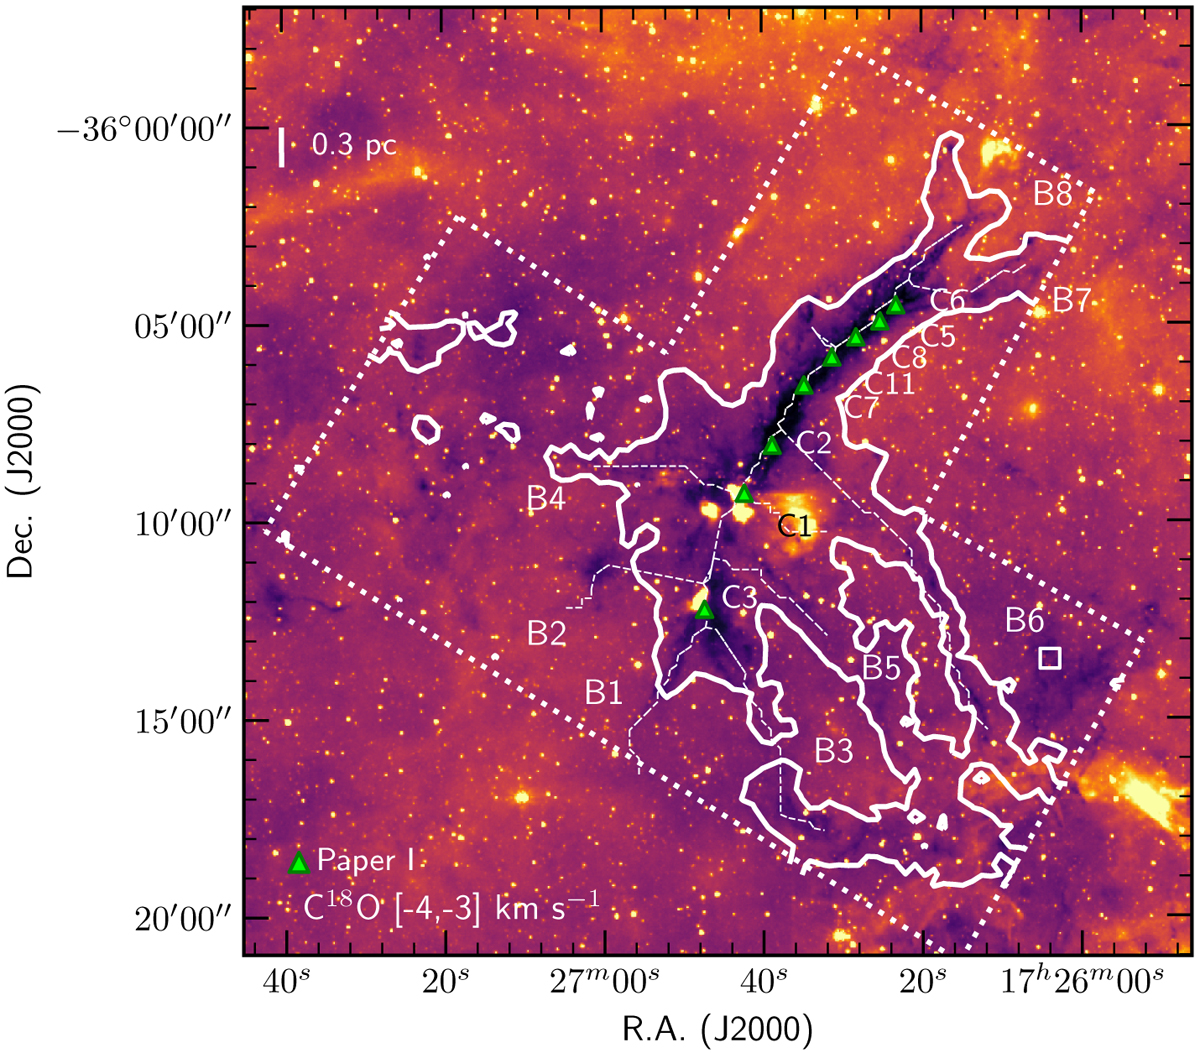
Spitzer 8 μm image of the molecular complex G351. The white contour is 5% of the C18O (2–1) peak intensity (17.6 K km s−1) integrated inthe velocity range − 3.5 ± 0.5 km s−1. The green triangles denote the ATLASGAL clumps identified in Paper I (see Table 1, labelled as C1, C2...). The skeleton of G351 and that of the branches is shown by the white dashed line. The white dotted lines indicate the region observed in CO isotopologues with APEX. The B1–B8 labels indicate the eight branches identified in the ![]() column density map (see Sect. 4.1). The white square on the south-west of G351 indicates the position of MSX IRDC G351.64–00.46 (Simon et al. 2006).
column density map (see Sect. 4.1). The white square on the south-west of G351 indicates the position of MSX IRDC G351.64–00.46 (Simon et al. 2006).
Current usage metrics show cumulative count of Article Views (full-text article views including HTML views, PDF and ePub downloads, according to the available data) and Abstracts Views on Vision4Press platform.
Data correspond to usage on the plateform after 2015. The current usage metrics is available 48-96 hours after online publication and is updated daily on week days.
Initial download of the metrics may take a while.


