Fig. 9.
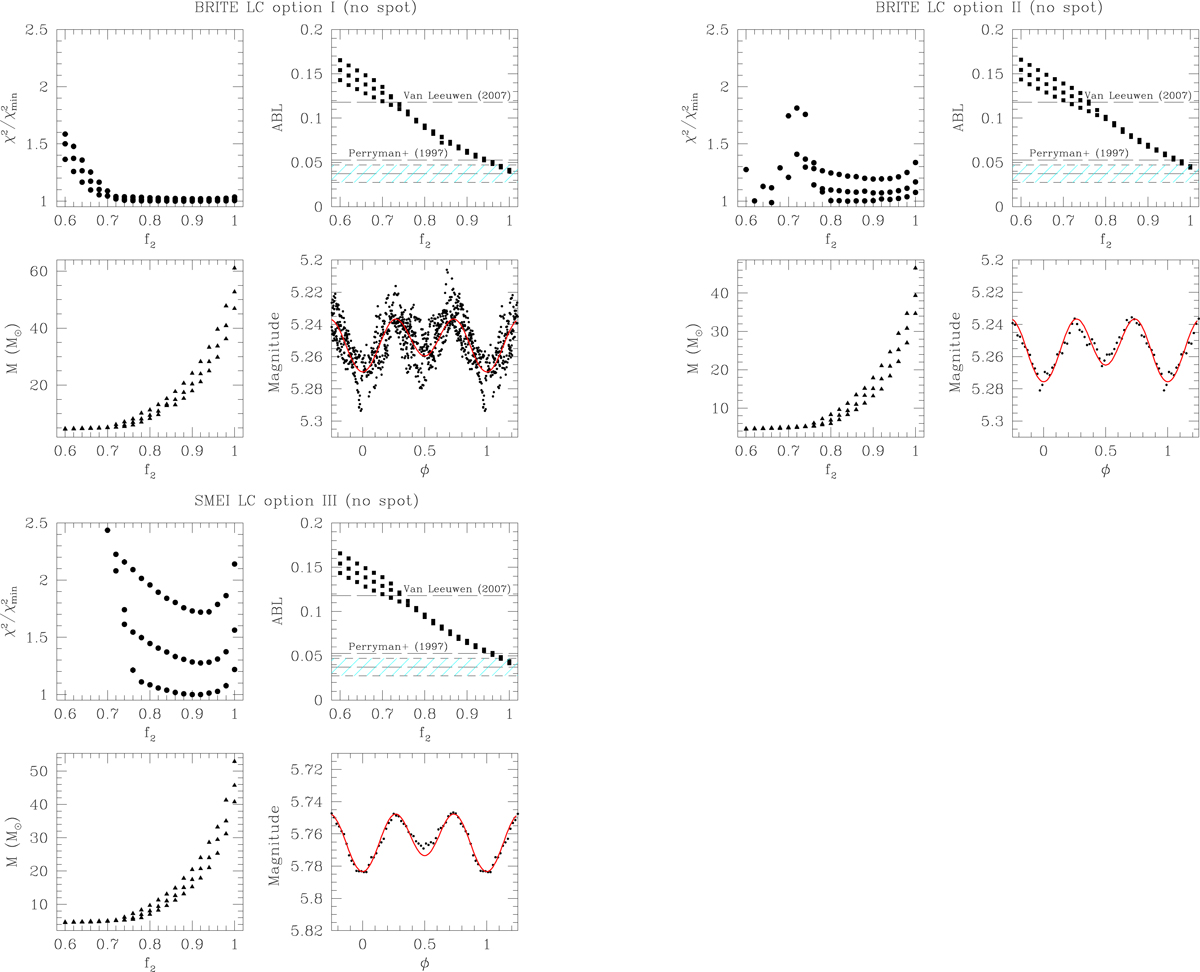
Properties of the best-fit models (assuming no surface spots) of the lightcurves for option I (spacecraft-orbit-averaged BRITE photometry, upper left quadrant), option II (binned BRITE lightcurve, upper right quadrant), and option III (binned SMEI lightcurve, lower left quadrant). For each option, the panels illustrate the fit quality, the astrometry-based luminosity ABL (see text), and the total mass of the system as a function of the secondary filling factor. The blue hatched area in the ABL panels indicates the value of ABLDR2 and its associated uncertainty. The lower right panel of each quadrant compares the lightcurve with the fit with the lowest χ2 that also agrees with the value of ABLDR2 (see Table 2).
Current usage metrics show cumulative count of Article Views (full-text article views including HTML views, PDF and ePub downloads, according to the available data) and Abstracts Views on Vision4Press platform.
Data correspond to usage on the plateform after 2015. The current usage metrics is available 48-96 hours after online publication and is updated daily on week days.
Initial download of the metrics may take a while.