Fig. 8.
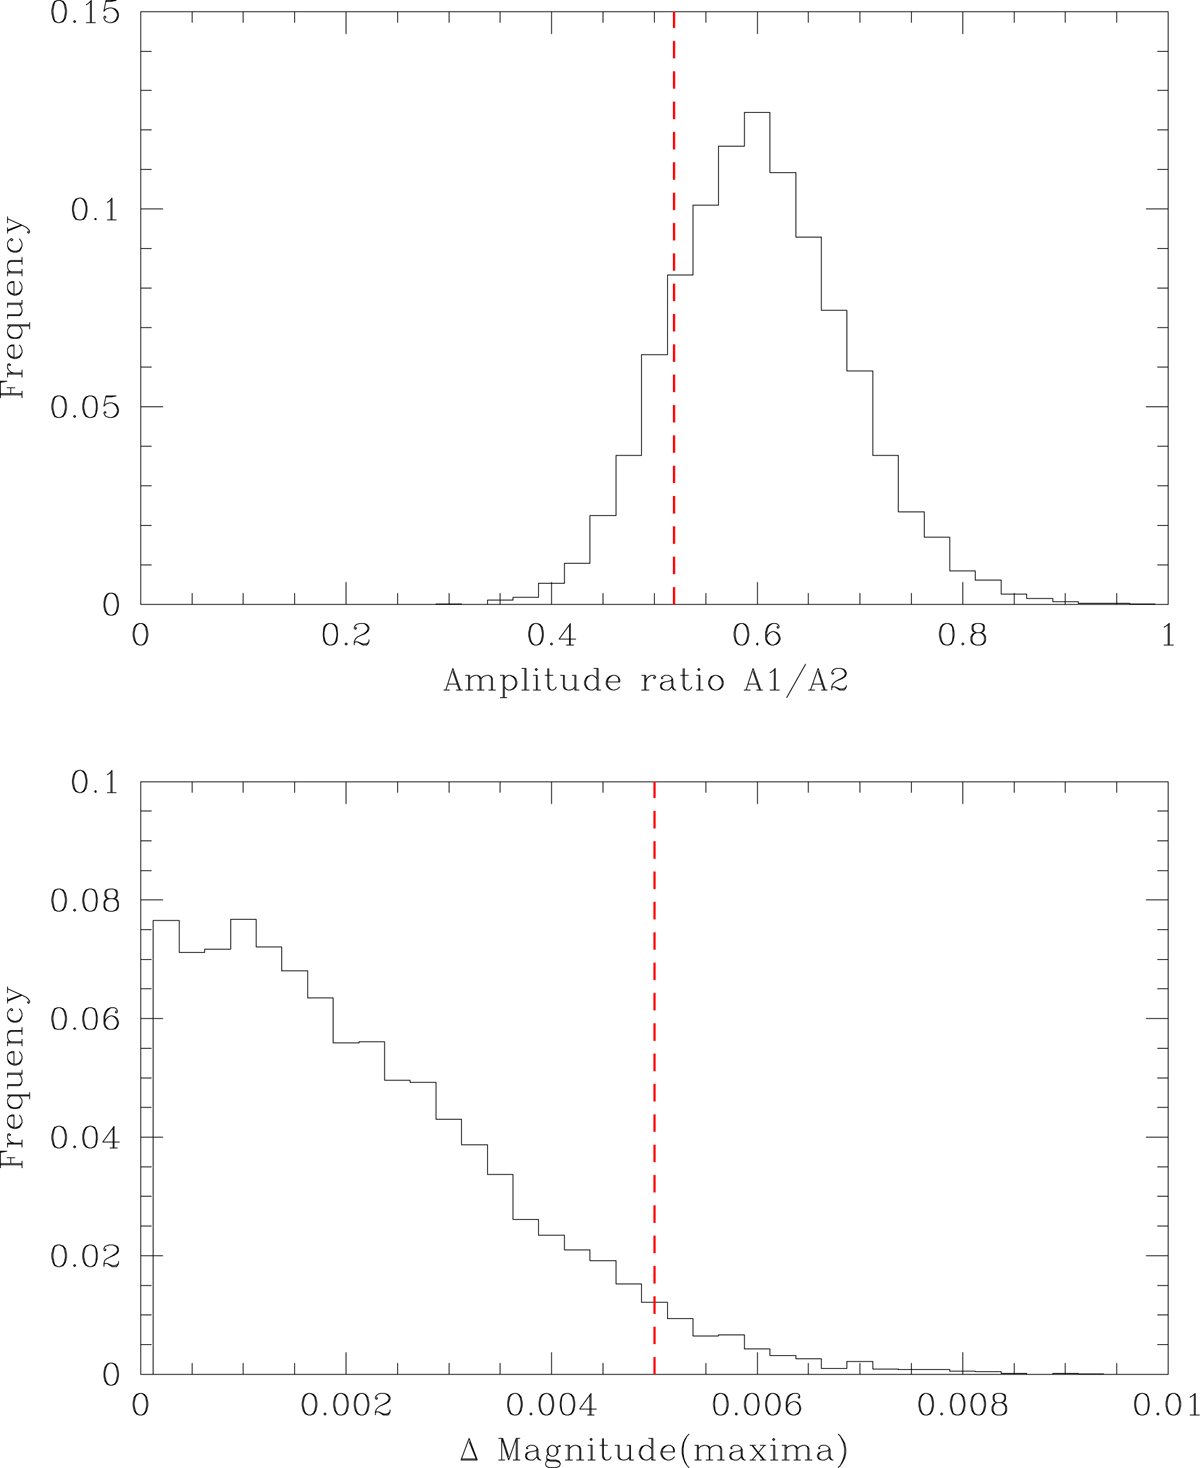
Top panel: histogram of the ratio between the semi-amplitudes of the orbital frequency and its second harmonic as obtained with the Monte Carlo simulations. The dashed vertical line indicates the observed value of the semi-amplitude ratio obtained via pre-whitening of the lightcurve averaged over the BRITE spacecraft orbit (A1/A2)BRITE = 0.52 ± 0.05. Bottom panel: histogram of the difference between the two maxima of the simulated lightcurves. The observed value of this difference in the BRITE lightcurve (≃0.005 mag) is again shown by the dashed vertical line.
Current usage metrics show cumulative count of Article Views (full-text article views including HTML views, PDF and ePub downloads, according to the available data) and Abstracts Views on Vision4Press platform.
Data correspond to usage on the plateform after 2015. The current usage metrics is available 48-96 hours after online publication and is updated daily on week days.
Initial download of the metrics may take a while.