Fig. 6.
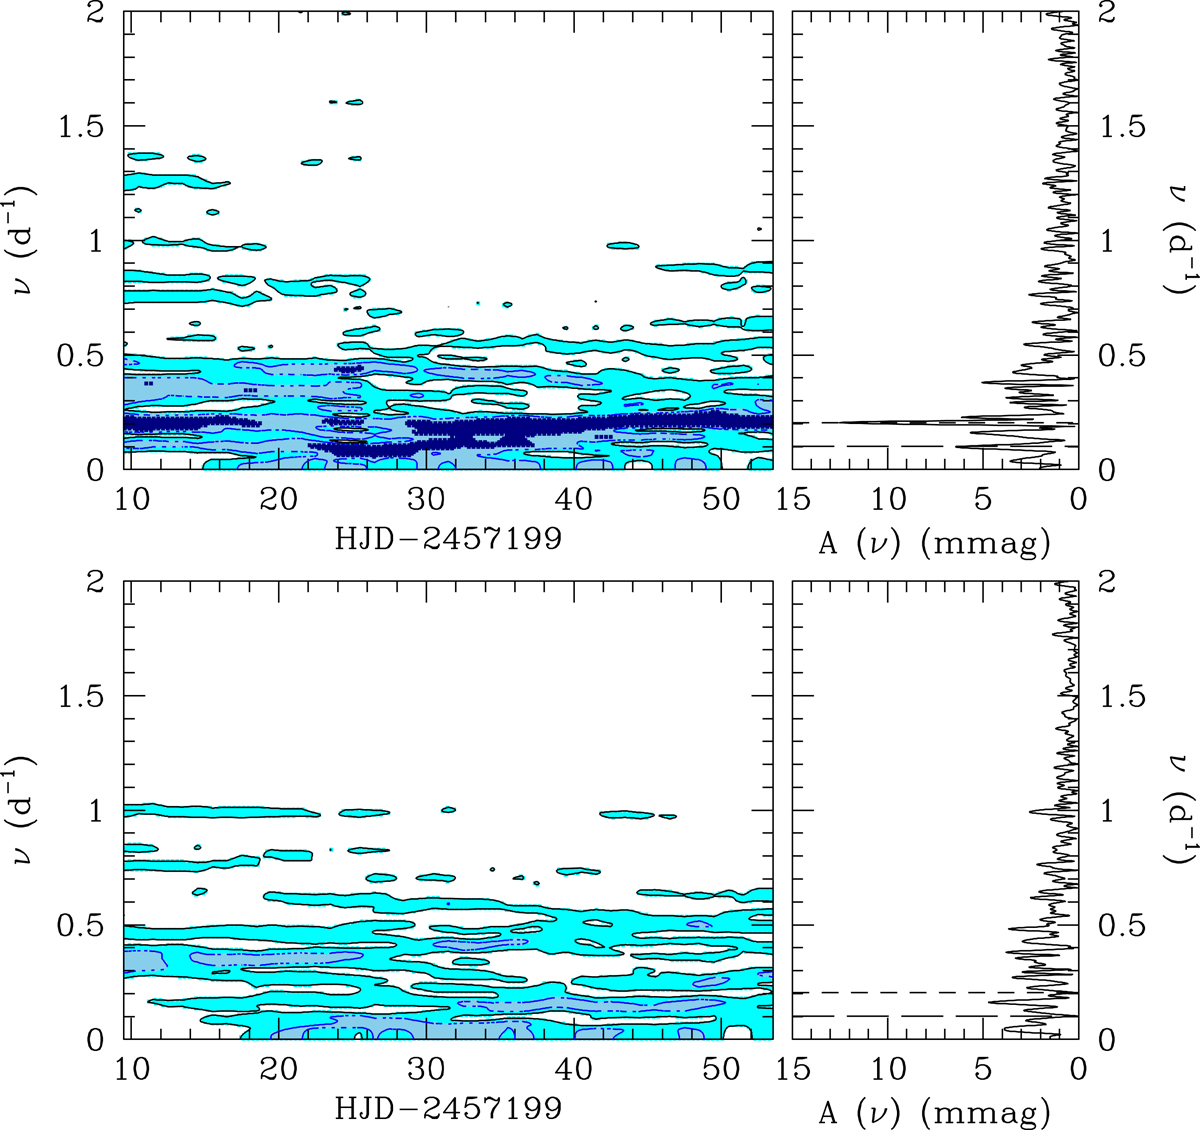
Time-frequency diagrams of the decorrelated photometry of HD 149 404, averaged over the spacecraft orbit before (upper panels) and after (lower panels) pre-whitening for Porb and Porb/2. Left panels: evolution of the Fourier periodogram as a function of the heliocentric Julian day at the middle of the 20-day sliding window (see text). Dark blue, light blue, and cyan stand respectively for semi-amplitudes ≥9 mmag, ≥6 mmag, and ≥3 mmag. Right panels: Fourier periodograms over the full duration of the BRITE campaign.
Current usage metrics show cumulative count of Article Views (full-text article views including HTML views, PDF and ePub downloads, according to the available data) and Abstracts Views on Vision4Press platform.
Data correspond to usage on the plateform after 2015. The current usage metrics is available 48-96 hours after online publication and is updated daily on week days.
Initial download of the metrics may take a while.