Free Access
Fig. 5.
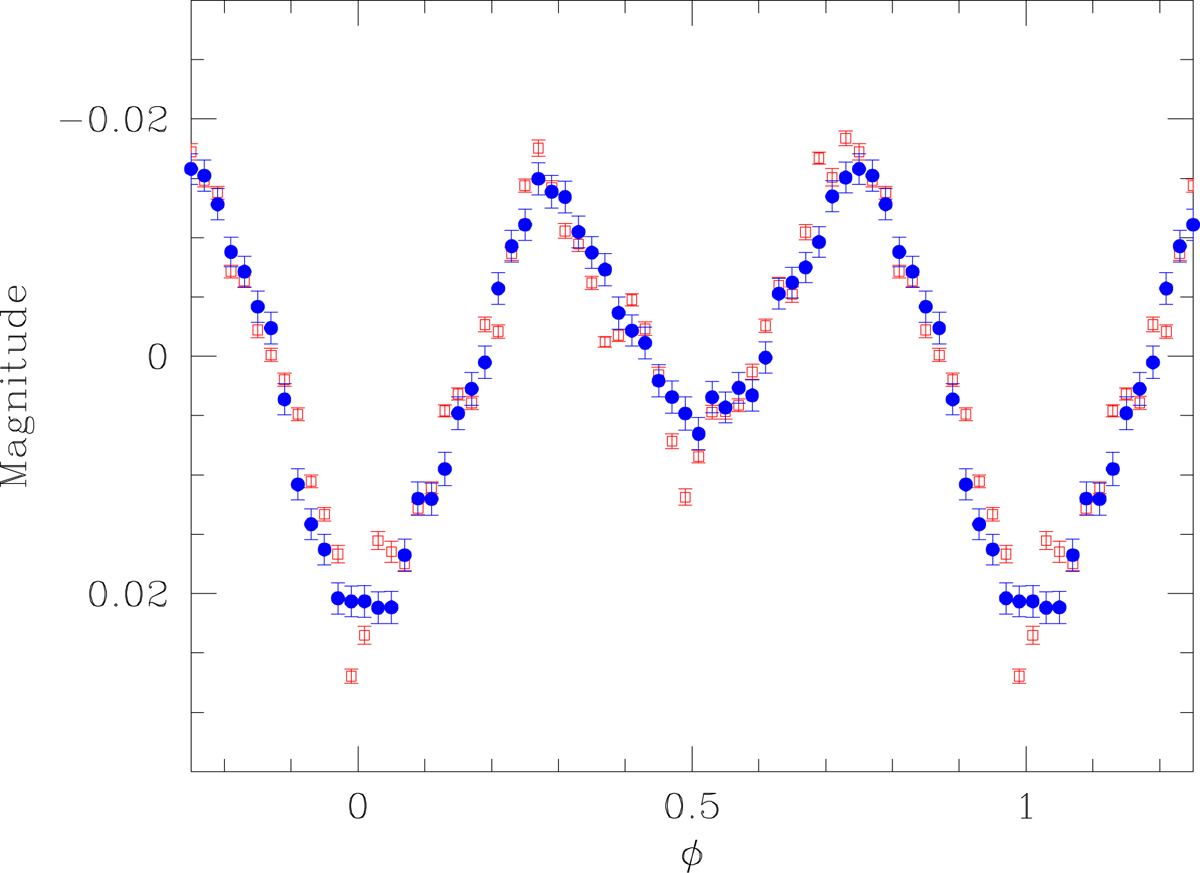
Comparison between the BRITE (red open squares) and SMEI (filled blue dots) lightcurve folded with the orbital period of HD 149 404. The data points correspond to normal points built adopting a phase bin of 0.02. To highlight the actual variations, the mean magnitudes are subtracted from both lightcurves.
Current usage metrics show cumulative count of Article Views (full-text article views including HTML views, PDF and ePub downloads, according to the available data) and Abstracts Views on Vision4Press platform.
Data correspond to usage on the plateform after 2015. The current usage metrics is available 48-96 hours after online publication and is updated daily on week days.
Initial download of the metrics may take a while.