Fig. 3.
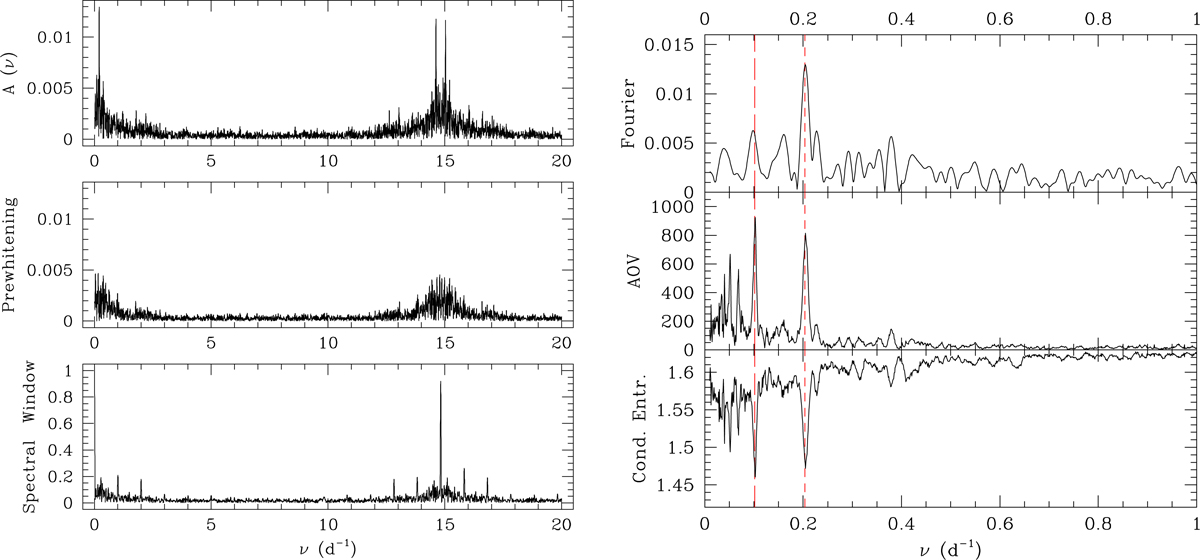
Left panels: Fourier periodogram of the decorrelated BRITE photometry of HD 149 404 in the frequency range 0 to 20 d−1 (upper panel) and after pre-whitening of Porb and Porb/2 (middle panel). Semi-amplitudes are expressed in magnitudes. Lower panel: spectral window. Right panels: zoomed-in version of the frequency range between 0 and 1 d−1. Upper, middle, and lower panels: Fourier periodogram, analysis of variance (AoV), and conditional entropy methods, respectively. In the Fourier and AoV method a detection of a signal corresponds to a peak, whereas in the conditional entropy method a detection is indicated by a minimum. The long- and short-dashed red lines correspond to νorb and 2 × νorb, respectively.
Current usage metrics show cumulative count of Article Views (full-text article views including HTML views, PDF and ePub downloads, according to the available data) and Abstracts Views on Vision4Press platform.
Data correspond to usage on the plateform after 2015. The current usage metrics is available 48-96 hours after online publication and is updated daily on week days.
Initial download of the metrics may take a while.