Fig. 5
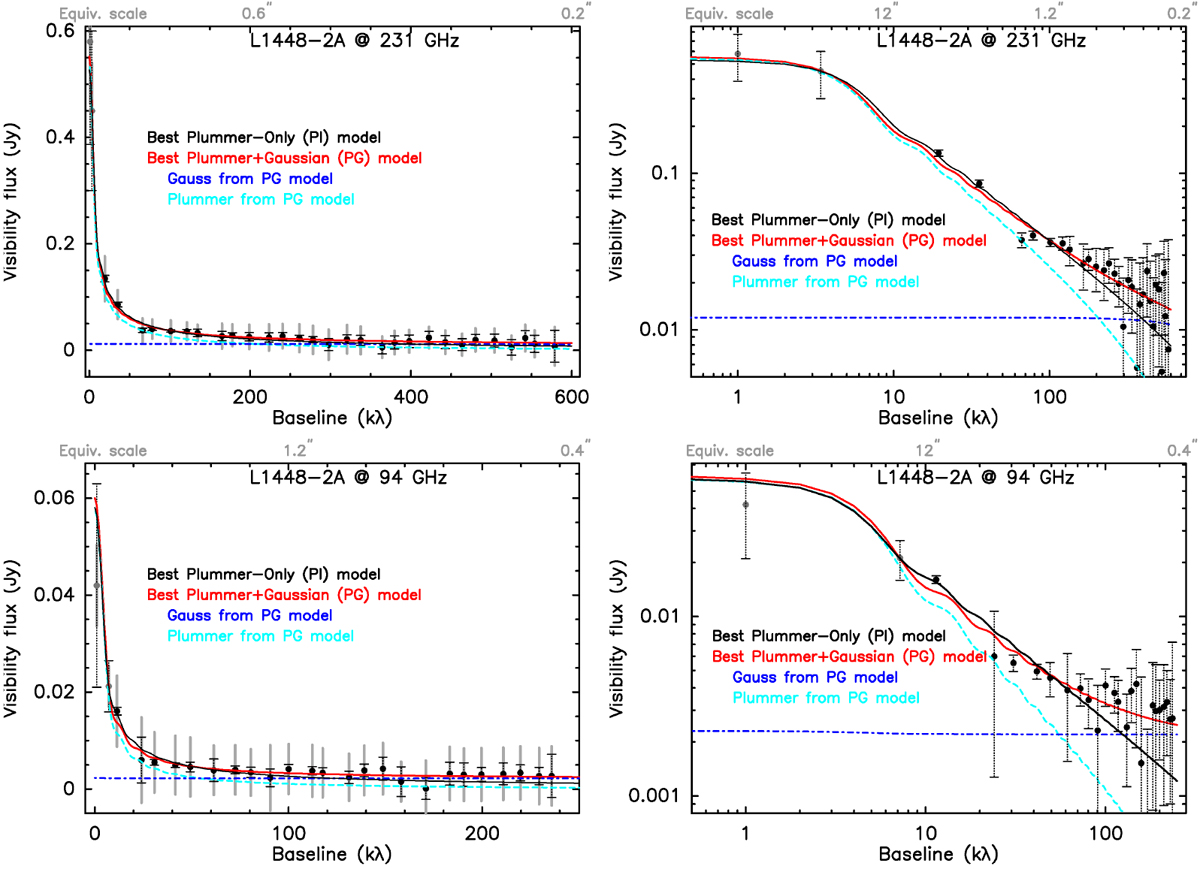
Top panels: 1.3 mm (231 GHz) PdBI dust continuum emission visibility real parts as a function of baseline length (circularly averaged in 20 kλ bins) for L1448-2A. The left panel uses a linear scale, while the right panel shows the same data and models in logarithmic scale to enhance the visibility of the long baseline points. The equivalent scales probed by the baselines in the image space are indicated at the top of each panel (computed as 0.6 × λ∕b). In both panels, the plain lines show the best-fit Plummer-only envelope (Pl, black) and Plummer + Gaussian (PG, red) models we found to reproduce the visibility profile of the dust continuum emission in this source. The dashedlines show the two components included in the best-fit PG model: the Plummer-envelope component in dashed lightblue and the additional Gaussian component in dot-dashed dark blue (see Table 6 for more information on the two models). The Plummer + Gaussian (PG) model is not statistically better than the Plummer-only (Pl) for L1448-2A. Bottom panels: same as the top panels for the 94 GHz visibility profiles.
Current usage metrics show cumulative count of Article Views (full-text article views including HTML views, PDF and ePub downloads, according to the available data) and Abstracts Views on Vision4Press platform.
Data correspond to usage on the plateform after 2015. The current usage metrics is available 48-96 hours after online publication and is updated daily on week days.
Initial download of the metrics may take a while.