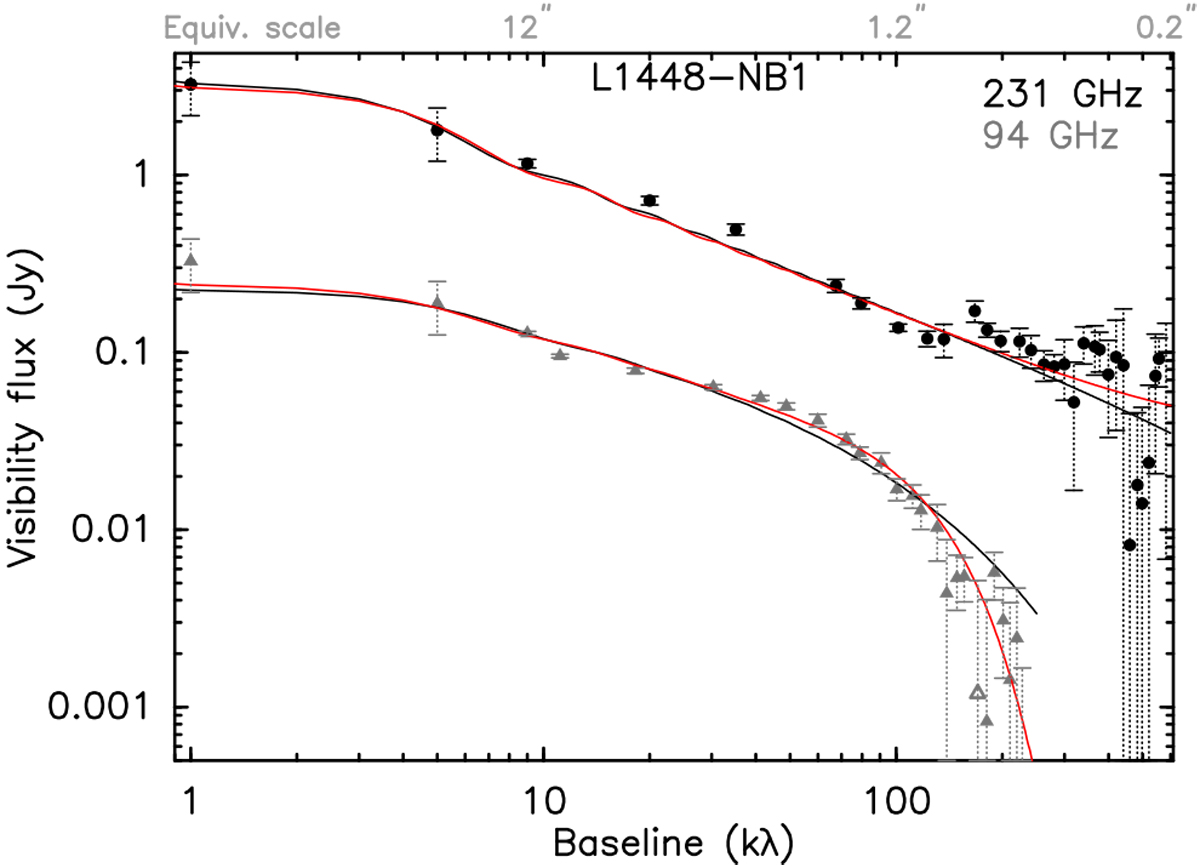
Fig. C.3

Visibility profiles of the 231 GHz (black dots) and 94 GHz (gray triangles) continuum emission from L1448-NB1.Open symbols are used when the visibility real part has a negative value (since absolute values are shown in the log–log plot). In each visibility curve, we show both the best Plummer-only model (Pl, black curve) and the best Plummer + Gauss (PG, red curve) model. In the case of L1448-NB1, the F-test suggests that the PG model for the 231 GHz profile does not perform statistically better than the Plummer-only (Pl) model (see Table 6 for more information on the two models). For the 94 GHz profile, the PG model that includes a 0.94′′ Gaussian component performs better than the Pl model, although none of the two models does satisfactorily reproduce the visibility profile (reduced chi square > 3 in both cases).
Current usage metrics show cumulative count of Article Views (full-text article views including HTML views, PDF and ePub downloads, according to the available data) and Abstracts Views on Vision4Press platform.
Data correspond to usage on the plateform after 2015. The current usage metrics is available 48-96 hours after online publication and is updated daily on week days.
Initial download of the metrics may take a while.


