Fig. 2
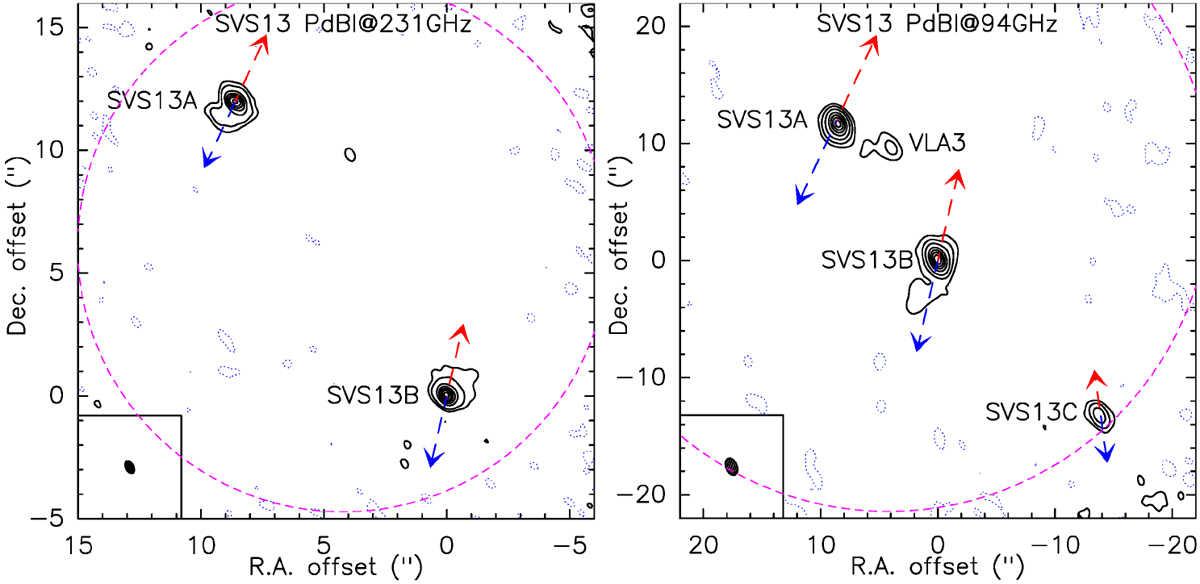
Same as Fig. 1 for the SVS13 region. The dashed pink contour shows the PdBI primary beam at each frequency. The contours show levels of −3σ (dashed), 5σ, and 10σ, then from 20σ in steps of 20σ (see Table 2). The blue and red arrows show the direction of the protostellar jets from our CALYPSO data for SVS13A/B (Podio et al., in prep.), while the SVS13C outflow PA stems from the CARMA map (Plunkett et al. 2013).
Current usage metrics show cumulative count of Article Views (full-text article views including HTML views, PDF and ePub downloads, according to the available data) and Abstracts Views on Vision4Press platform.
Data correspond to usage on the plateform after 2015. The current usage metrics is available 48-96 hours after online publication and is updated daily on week days.
Initial download of the metrics may take a while.