Open Access
Fig. B.5
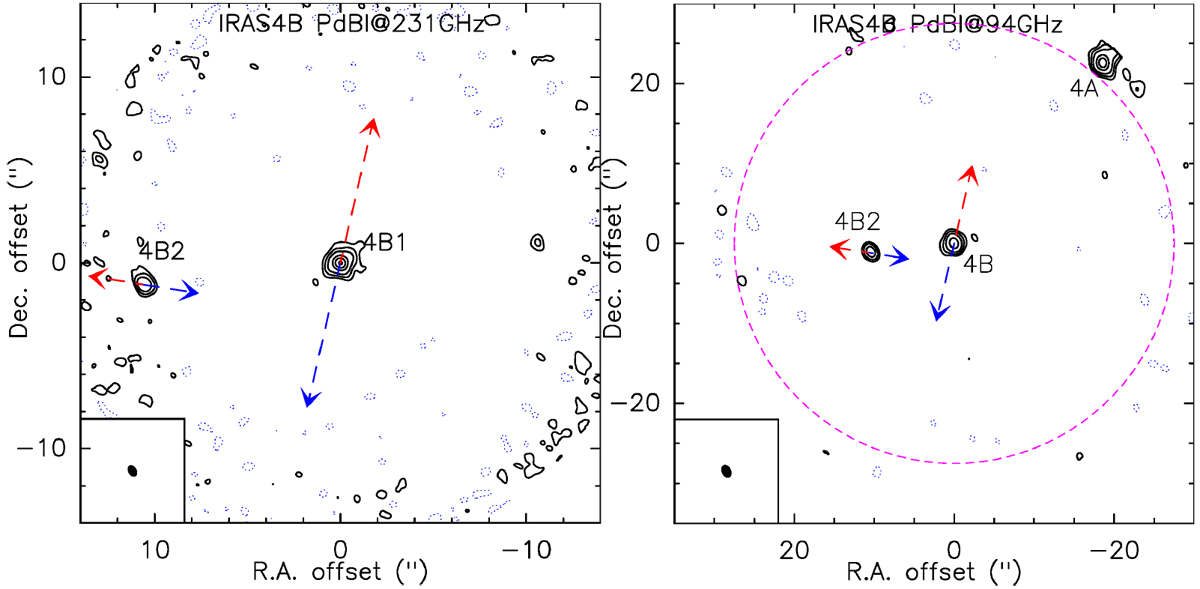
Same as Fig. B.1 for IRAS4B. The contours show levels of −3σ (dashed), 5σ, and 10σ and then usesteps of 30σ from 20σ on. The fluxdensity in the maps has been corrected for primary beam attenuation (the primary beam FWHM is shown as a pink dashed circle in the 94 GHz map).
Current usage metrics show cumulative count of Article Views (full-text article views including HTML views, PDF and ePub downloads, according to the available data) and Abstracts Views on Vision4Press platform.
Data correspond to usage on the plateform after 2015. The current usage metrics is available 48-96 hours after online publication and is updated daily on week days.
Initial download of the metrics may take a while.