Open Access
Fig. B.4
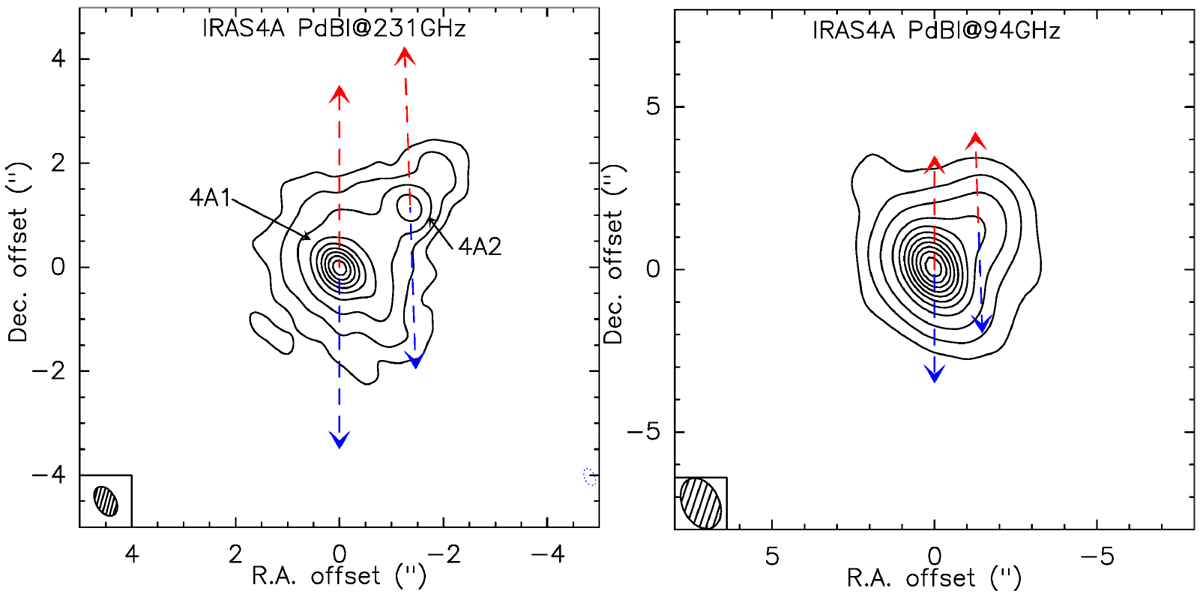
Same as Fig. B.1 for IRAS4A. The contours show levels of −3σ (dashed), 5σ, and 10σ and then usesteps of 20σ from 20σ on. IRAS4B is detected to the southwest in the 94 GHz map, outside the area shown here, so that the structure of IRAS4A is well distinguished in the figure.
Current usage metrics show cumulative count of Article Views (full-text article views including HTML views, PDF and ePub downloads, according to the available data) and Abstracts Views on Vision4Press platform.
Data correspond to usage on the plateform after 2015. The current usage metrics is available 48-96 hours after online publication and is updated daily on week days.
Initial download of the metrics may take a while.