Fig. B.1
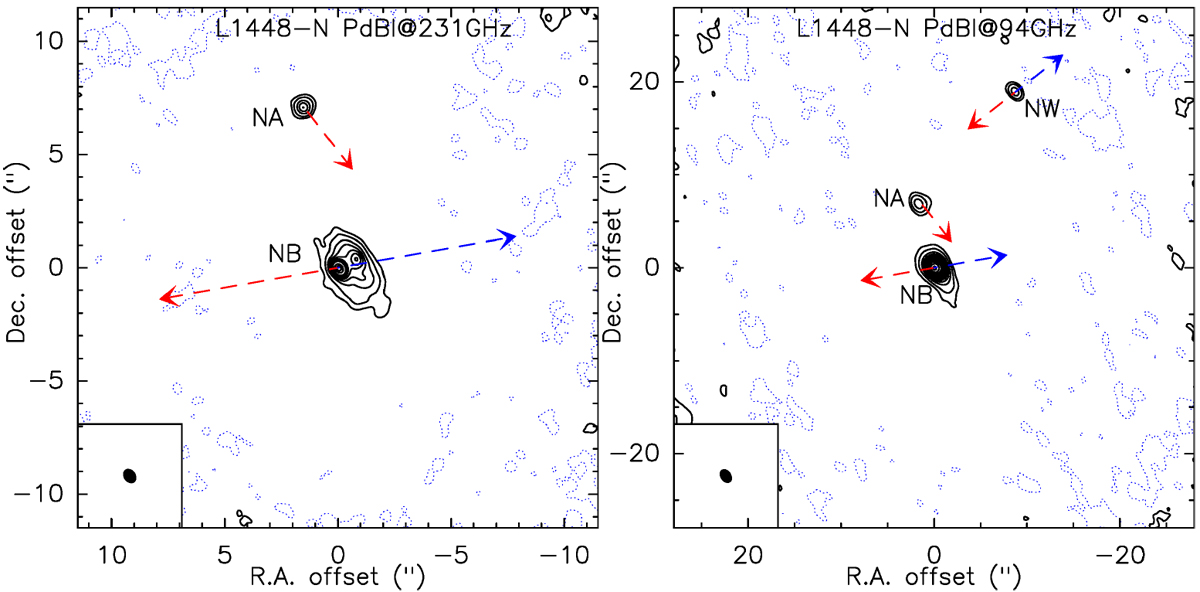
1.3 mm (231 GHz) and 3.3 mm (94 GHz) PdBI dust continuum emission maps of L1448-N. The ellipses in the bottom left corner show the respective synthesized beam sizes. The contours are levels of −3σ (dashed) and 5σ, then in stepsof 10σ from 10σ to 100σ, and finally in steps of 20σ beyond (rms noise computed in the map before primary beam correction as reported in Table 2). The maps have been corrected for primary beam attenuation. The blue and red arrows show the direction of the protostellar jet(s) associated with the millimeter sources in the field, see Table 1 for further details.
Current usage metrics show cumulative count of Article Views (full-text article views including HTML views, PDF and ePub downloads, according to the available data) and Abstracts Views on Vision4Press platform.
Data correspond to usage on the plateform after 2015. The current usage metrics is available 48-96 hours after online publication and is updated daily on week days.
Initial download of the metrics may take a while.