Fig. 2.
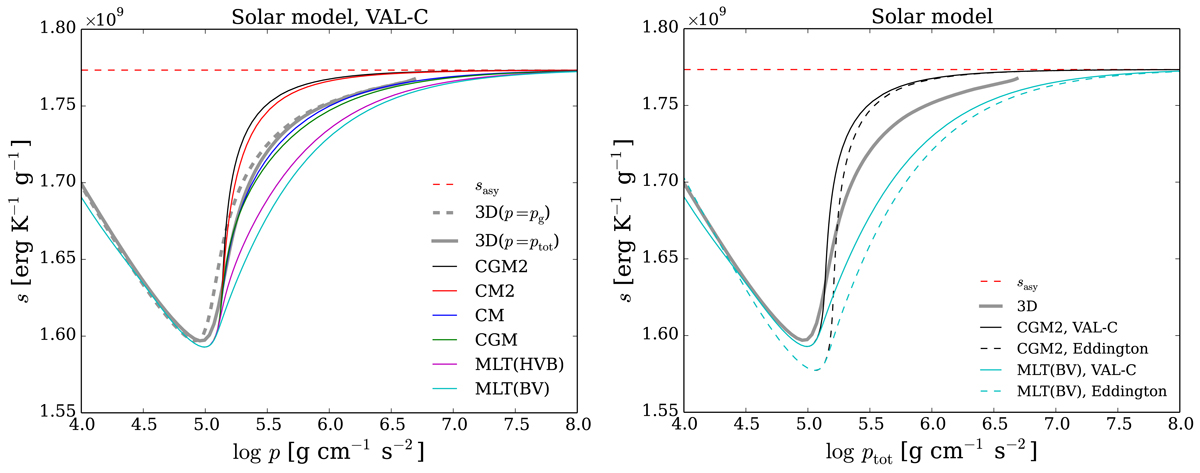
Same as Fig. 1, but for calibrated 1D models with different convection models and T(τ) relations. While the mixing length is determined as l = rtop − r + α*Hp, top, where the subscript “top” means the top of the convective envelope for CM2 and CGM2; l = αHp for the other cases. In the left panel, all the 1D models were constructed using the VAL-C T(τ). Right panel: 1D models with CGM2 and the BV version of MLT both for the VAL-C (solid lines) and the Eddington T(τ) (dashed lines). The 3D profile is shown as a function of total pressure (solid gray line). In the left panel, it is also shown as a function of gas pressure (dashed gray line).
Current usage metrics show cumulative count of Article Views (full-text article views including HTML views, PDF and ePub downloads, according to the available data) and Abstracts Views on Vision4Press platform.
Data correspond to usage on the plateform after 2015. The current usage metrics is available 48-96 hours after online publication and is updated daily on week days.
Initial download of the metrics may take a while.