Fig. 18.
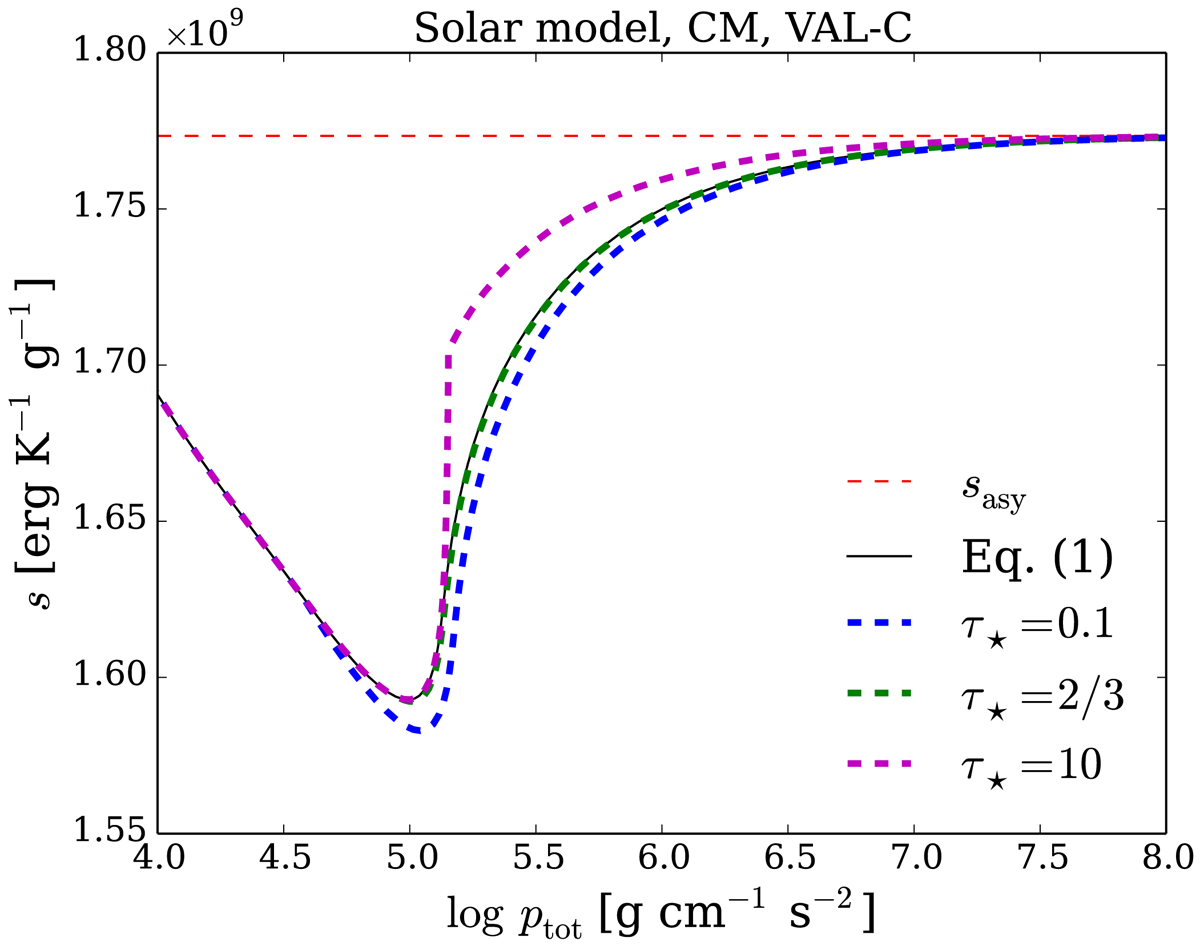
Same as Fig. 1, but for comparison of different ways to evaluate ∇rad. The profiles are 1D models calibrated using CM with the VAL-C T(τ). The black solid line was obtained by the method adopted to the 3D α calibration, using Eq. (1) and considering convection both in the optically thin and thick layers. The dashed lines were obtained by a method adopted by some evolution codes (see the text).
Current usage metrics show cumulative count of Article Views (full-text article views including HTML views, PDF and ePub downloads, according to the available data) and Abstracts Views on Vision4Press platform.
Data correspond to usage on the plateform after 2015. The current usage metrics is available 48-96 hours after online publication and is updated daily on week days.
Initial download of the metrics may take a while.