Fig. 16.
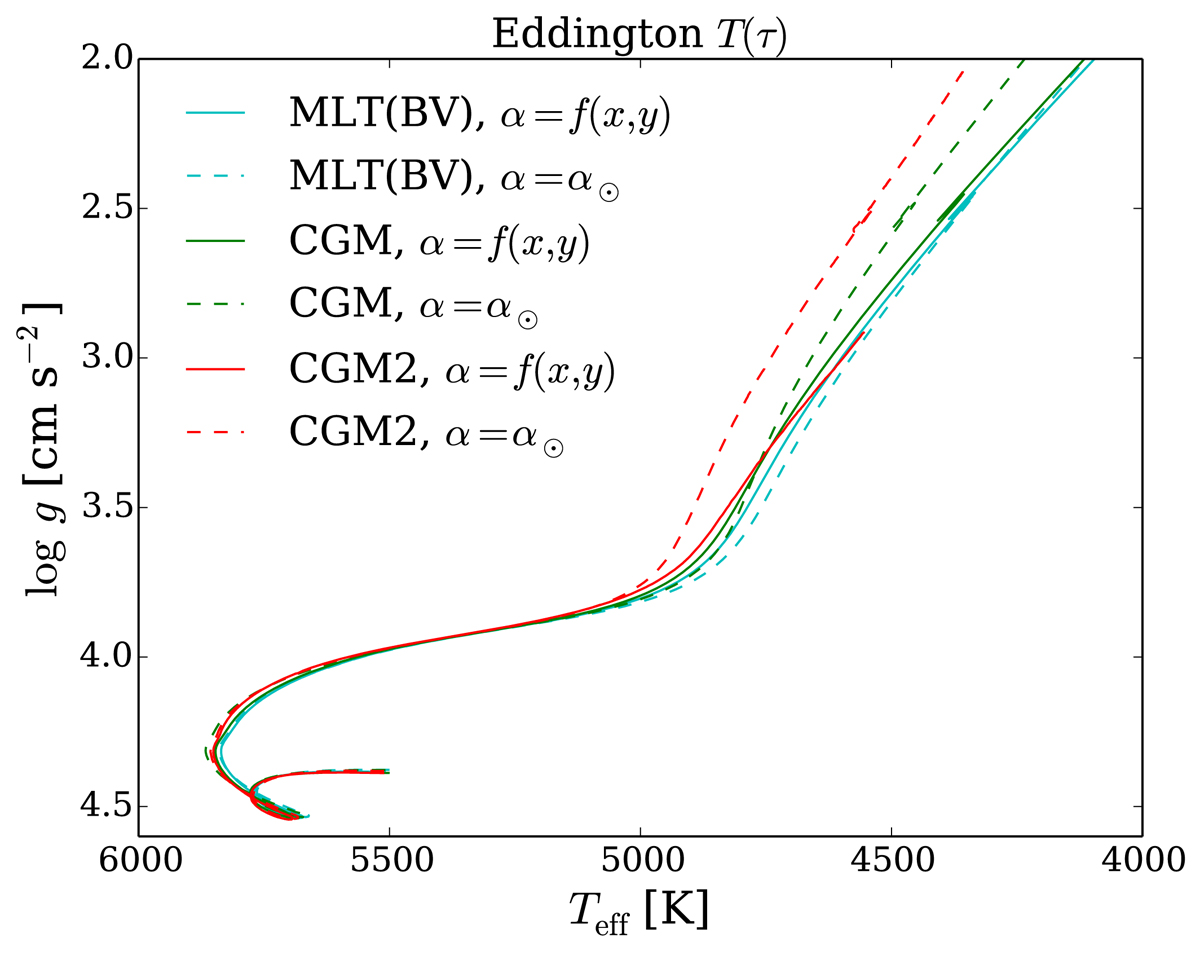
1 M⊙ evolutionary tracks obtained with the α values calibrated with the Eddington T(τ) relation. The solid lines are tracks with varying α which follows Eq. (4). The dashed lines indicate those with α fixed to the solar values (Table 1). In case of CGM2, the calibrated α* is negative for low Teff and g as mentioned in Sect. 3.4.1. In this figure, we truncated the negative-α* part of the evolutionary track with varying α* for CGM2.
Current usage metrics show cumulative count of Article Views (full-text article views including HTML views, PDF and ePub downloads, according to the available data) and Abstracts Views on Vision4Press platform.
Data correspond to usage on the plateform after 2015. The current usage metrics is available 48-96 hours after online publication and is updated daily on week days.
Initial download of the metrics may take a while.