Fig. 14.
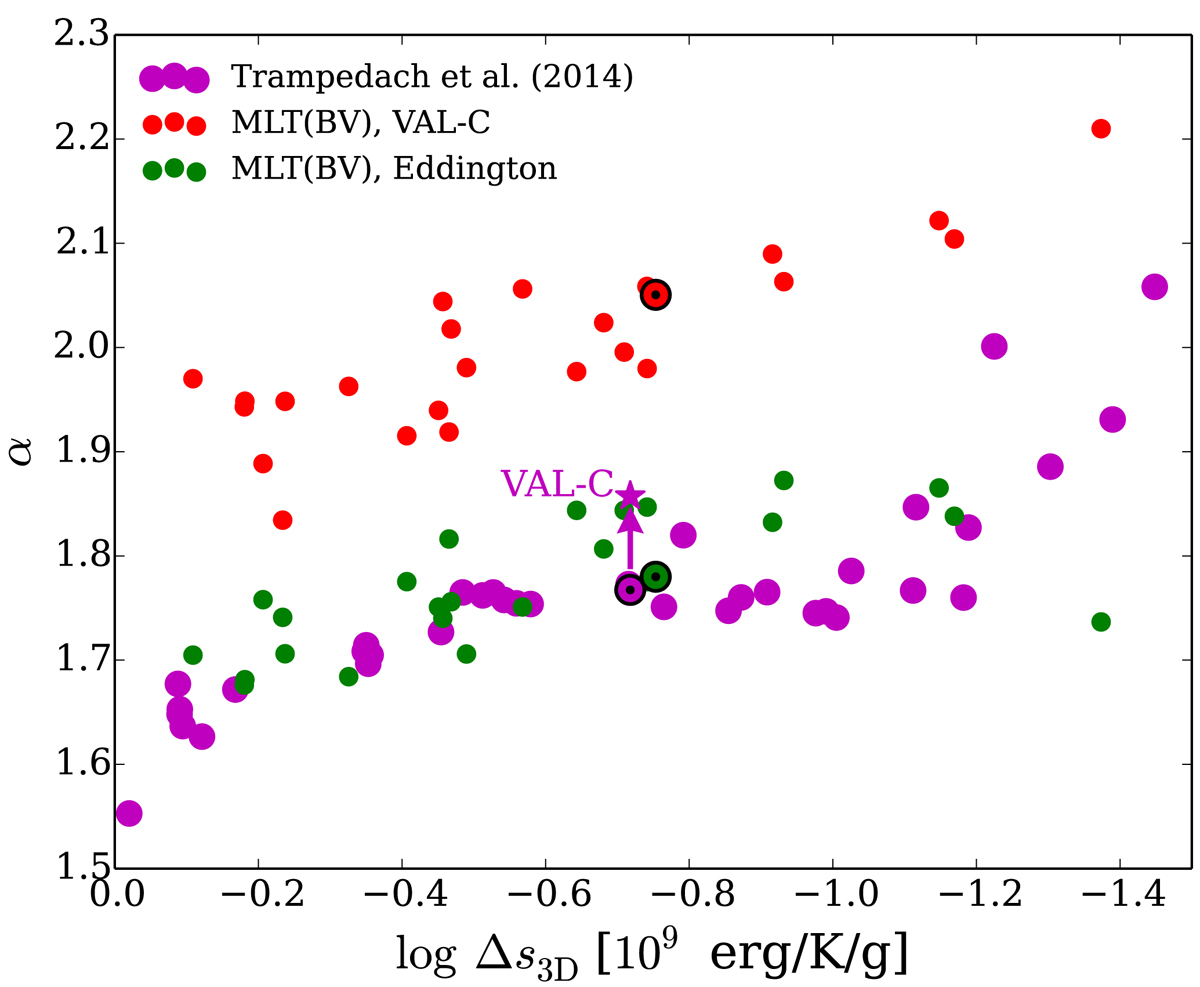
Comparison of the calibrated α values with Trampedach et al. (2014a). Similar to Trampedach et al. (2014a), the BV version of MLT is chosen to plot our α values. In Trampedach et al. (2014a), the T(τ) relation based on their 3D models (Trampedach et al. 2014b) is adopted for constructing the atmosphere part of their 1D models. Unlike the present work, their 1D models include turbulent pressure and the α calibration was performed by matching temperature in the adiabatic bottom part of a convective envelope. Their α values obtained by the above procedure are presented as the magenta dots. They also tested with the VAL-C T(τ) relation, and reported that the α value becomes 0.09 larger for the solar model than the case of the T(τ) relation based on the 3D models (the magenta star). The solar marks indicate the solar model.
Current usage metrics show cumulative count of Article Views (full-text article views including HTML views, PDF and ePub downloads, according to the available data) and Abstracts Views on Vision4Press platform.
Data correspond to usage on the plateform after 2015. The current usage metrics is available 48-96 hours after online publication and is updated daily on week days.
Initial download of the metrics may take a while.