Fig. 1.
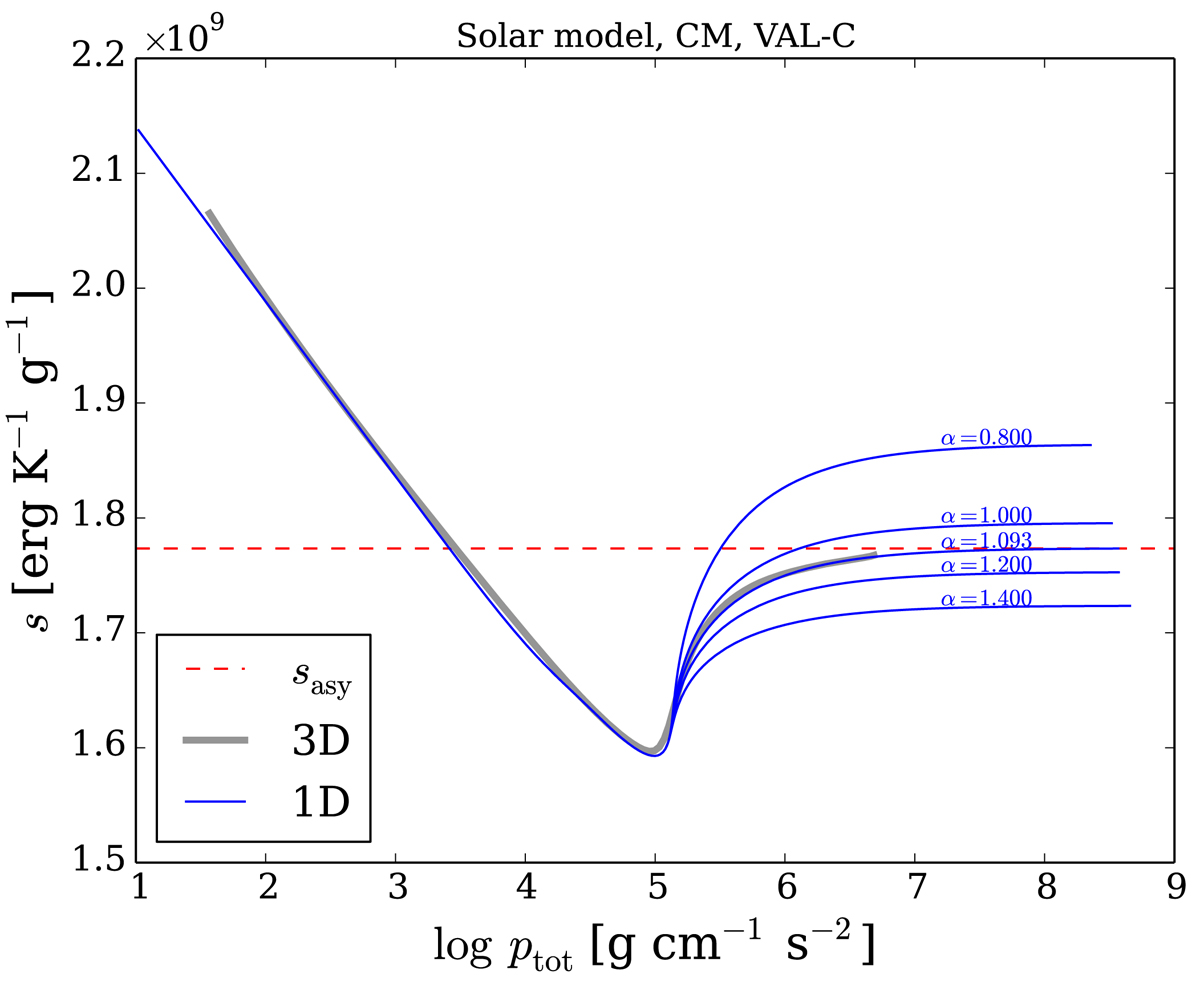
Entropy as a function of total pressure for the solar model. The thick gray line is the temporally and horizontally averaged entropy in the 3D model, and the thin blue lines are those in the 1D models with different values of the mixing-length parameter α, which are indicated near the blue lines. For the 1D models shown in this figure, CM and the VAL-C T(τ) relation were used. The horizontal dashed red line indicates the asymptotic entropy of the 3D model, sasy.
Current usage metrics show cumulative count of Article Views (full-text article views including HTML views, PDF and ePub downloads, according to the available data) and Abstracts Views on Vision4Press platform.
Data correspond to usage on the plateform after 2015. The current usage metrics is available 48-96 hours after online publication and is updated daily on week days.
Initial download of the metrics may take a while.