Fig. 9.
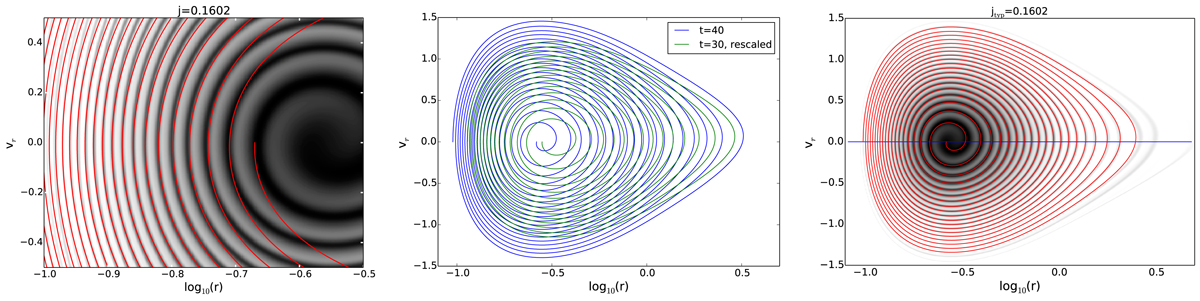
Spiral shape vs. self-similar predictions for the VlaSolve run with (η, n) = (0.5, −1.0). Left panel: comparison, at t = 40, of the local shape of the spiral structure in the region dominated by centrifugal force to the curve given by Eq. (46) (red curve). Middle panel: test for self-similarity in time. The green spiral shape obtained at t = 30 is rescaled according to Eqs. (47) and (48) to be compared to the blue one, in the regime dominated by centrifugal force. Right panel: using only the determination of the position of the folds in the region dominated by centrifugal force, it is possible to draw the full shape of the spiral if the gravitational potential is known by interpolating the specific energy in angle coordinate defined by Eqs. (49)–(51).
Current usage metrics show cumulative count of Article Views (full-text article views including HTML views, PDF and ePub downloads, according to the available data) and Abstracts Views on Vision4Press platform.
Data correspond to usage on the plateform after 2015. The current usage metrics is available 48-96 hours after online publication and is updated daily on week days.
Initial download of the metrics may take a while.