Fig. 8.
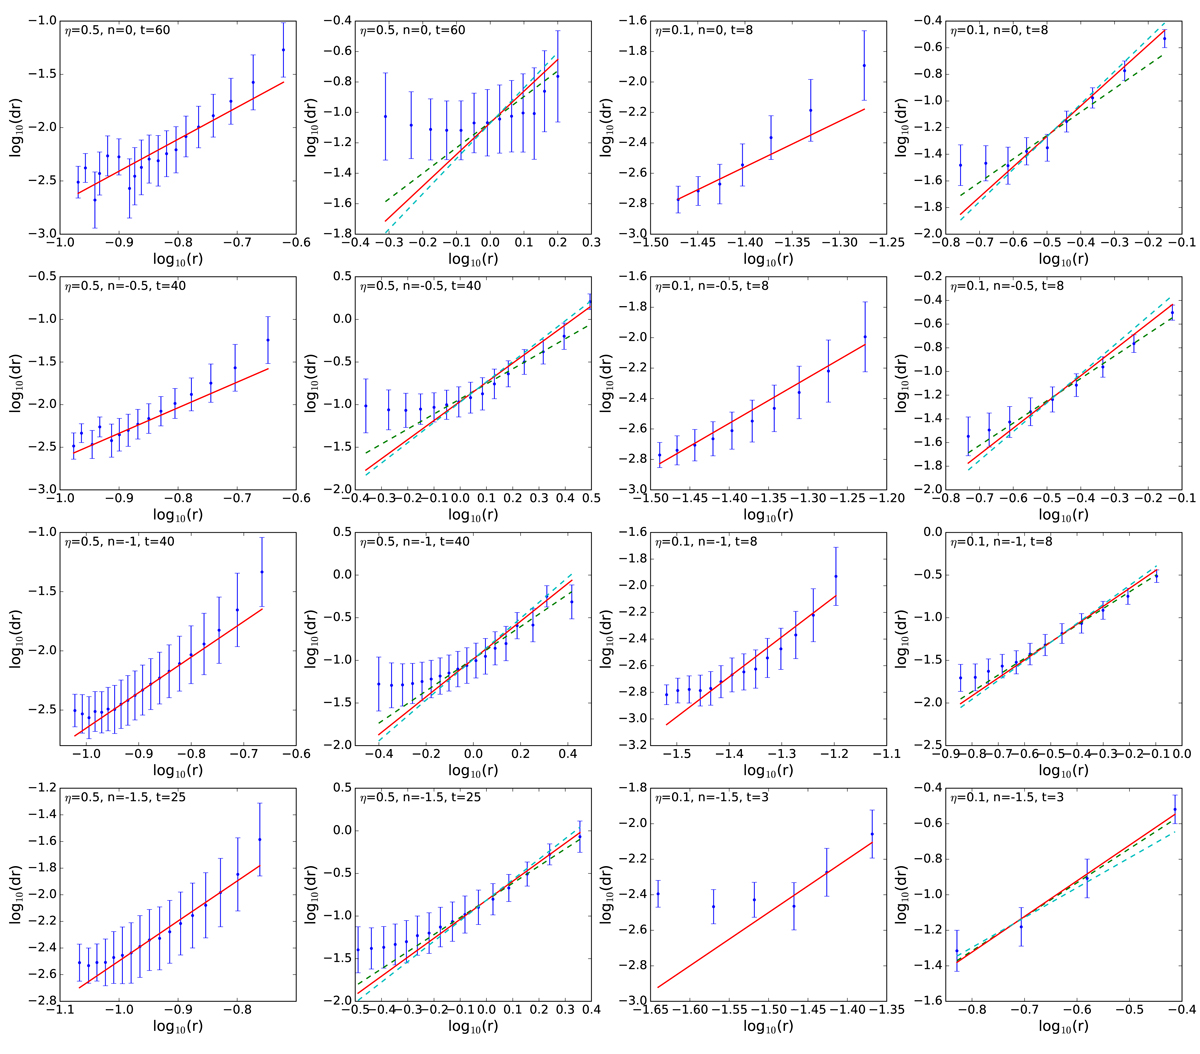
Interfold distance at null radial velocity vs. self-similar predictions for a fixed value of angular momentum. The distance dr between local maxima of the function f(r, υr = 0, j) is plotted as a function of r for the VlaSolve runs with various initial conditions. The time considered corresponds to the middle column of panels in Figs. 1 and 2. The two left columns of panels correspond to the “warm” case, η = 0.5 with j = 0.16, and the two right ones to the “cool” case, η = 0.1 with j = 0.06. Then, odd column numbers (1 and 3) and even column numbers (2 and 4) correspond to the regime where centrifugal/gravitational force dominates, respectively. On each panel a red line indicates the logarithmic slope predicted by self-similarity. When the gravitational force dominates, two additional dashed curves provide a bracket of the estimated slope taking into account deviations from self-similarity, i.e. variations of the effective logarithmic slope of the gravitational force.
Current usage metrics show cumulative count of Article Views (full-text article views including HTML views, PDF and ePub downloads, according to the available data) and Abstracts Views on Vision4Press platform.
Data correspond to usage on the plateform after 2015. The current usage metrics is available 48-96 hours after online publication and is updated daily on week days.
Initial download of the metrics may take a while.