Fig. 7.
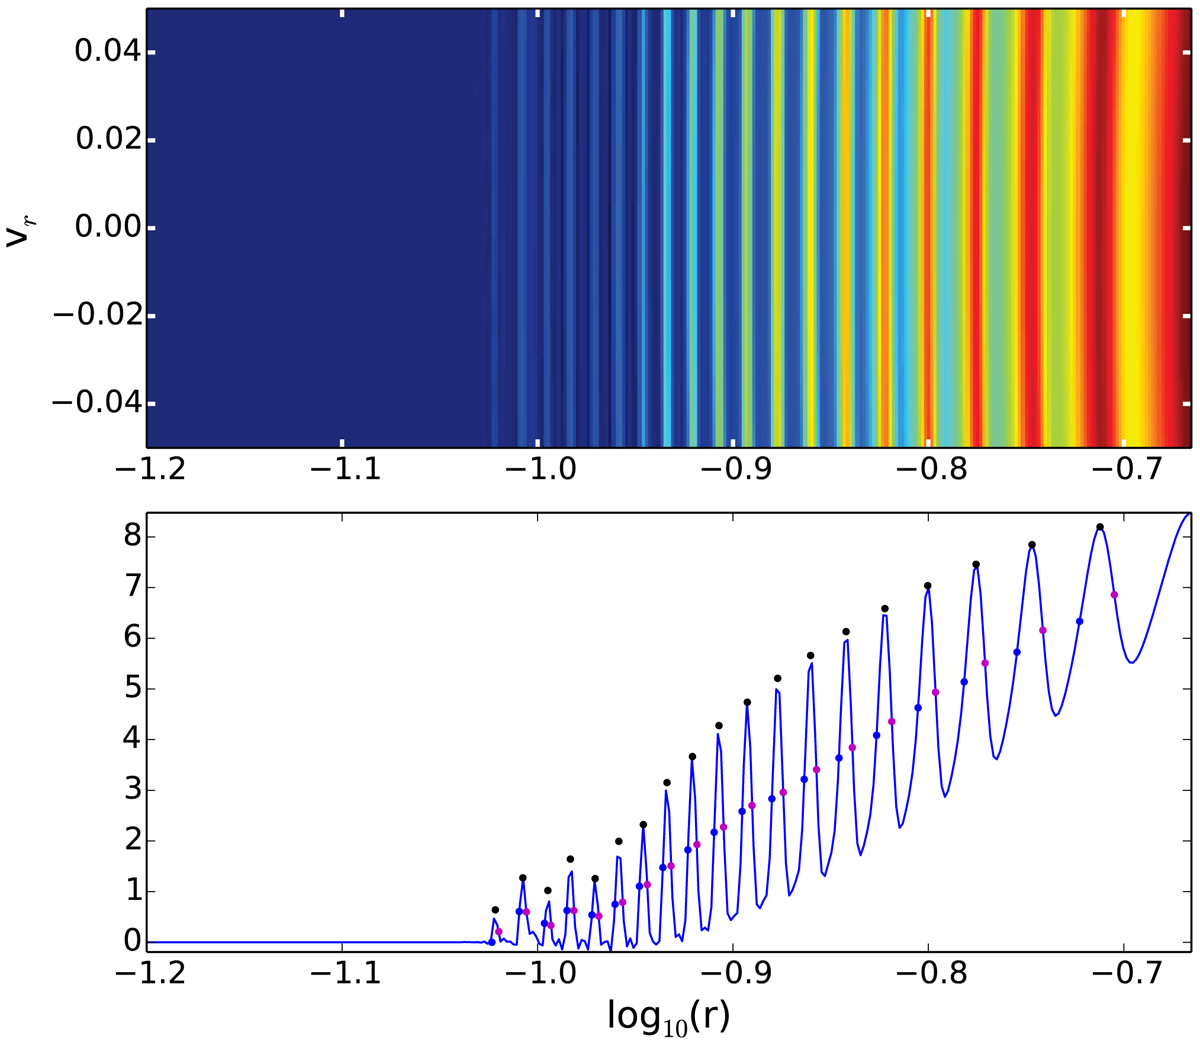
Illustration of the method used to determine the positions of the folds and corresponding interfold distance law at small radius in a phase-space slice. Top panel: zoom performed around the axis υr = 0 in the region dominated by centrifugal force for the (η, n) = (0.5, −1.0) simulation at t = 40. The corresponding phase-space distribution function f(r, υr = 0, j = 0.16) is plotted in the lower panel. The black dots give the positions of local maxima estimated with our local quadratic fit, while the blue and red dots provide upper and lower bounds to compute the (very conservative) error bars shown on Fig. 8.
Current usage metrics show cumulative count of Article Views (full-text article views including HTML views, PDF and ePub downloads, according to the available data) and Abstracts Views on Vision4Press platform.
Data correspond to usage on the plateform after 2015. The current usage metrics is available 48-96 hours after online publication and is updated daily on week days.
Initial download of the metrics may take a while.