Fig. 4.
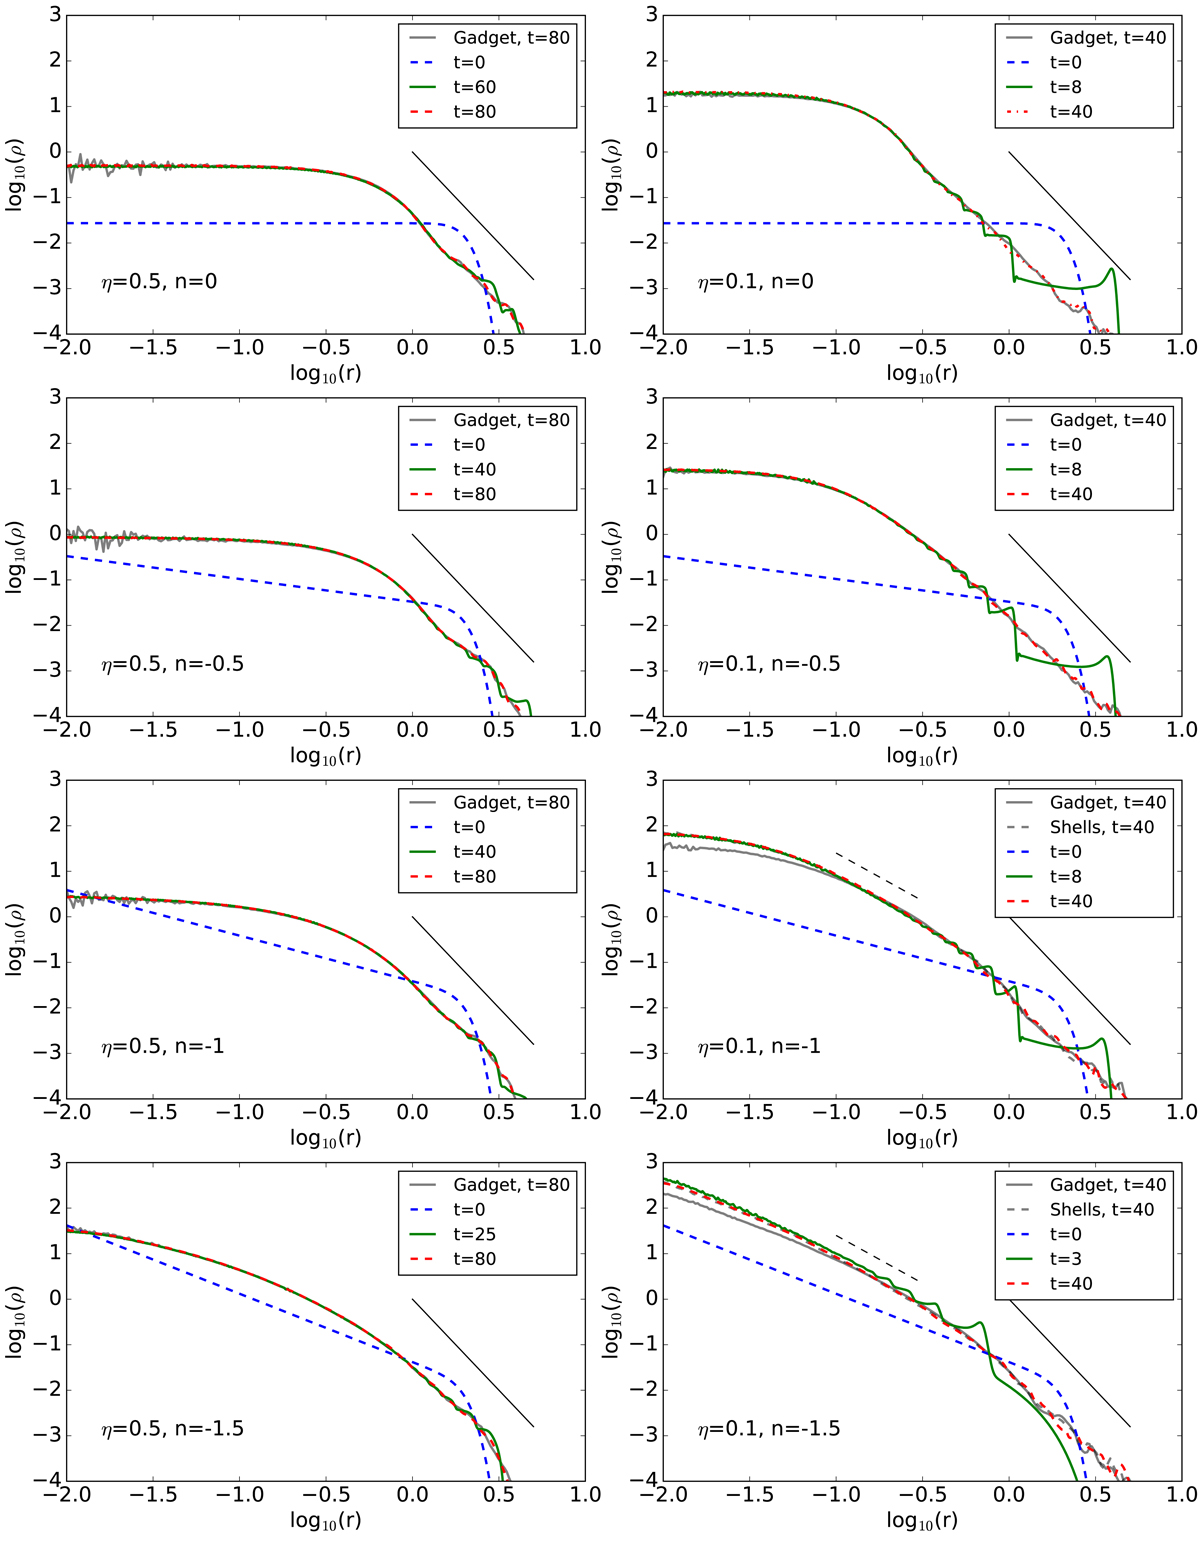
Radial density profile measured at various times in the VlaSolve simulations, namely initial conditions (blue dashes), intermediate time used to perform tests of self-similarity of the phase-space spiral (green), and final time (red dashes). For the final time, the results are also compared to a Gadget-2 run (thick grey), as well as the output of the shell code (thick grey dashes) for (η, n) = (0.1, −1) and (0.1, −1.5). In addition, the logarithmic slopes −4 and −2.1 (as measured in Hozumi et al. 2000) are shown respectively as a thin solid and a thin dashed line.
Current usage metrics show cumulative count of Article Views (full-text article views including HTML views, PDF and ePub downloads, according to the available data) and Abstracts Views on Vision4Press platform.
Data correspond to usage on the plateform after 2015. The current usage metrics is available 48-96 hours after online publication and is updated daily on week days.
Initial download of the metrics may take a while.