Fig. 9.
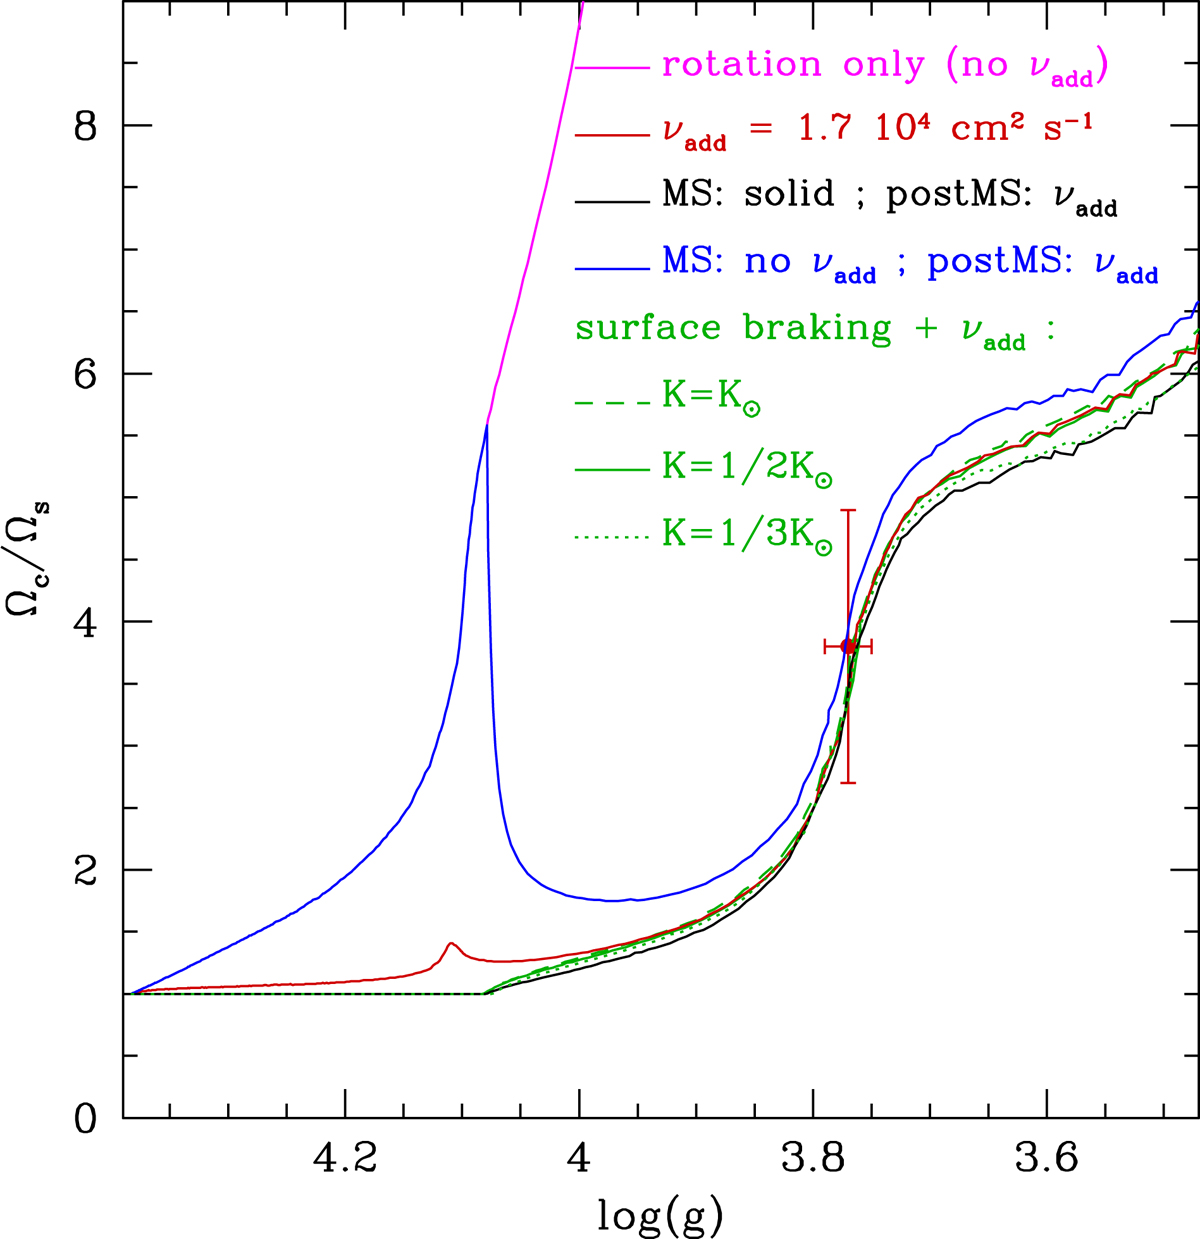
Ratio of core to surface rotation rates as a function of gravity for rotating models of star B. The magenta line corresponds to a model without additional viscosity. Black and blue lines indicate models computed with solid-body rotation and without additional viscosity during the MS, respectively. Both models include an additional viscosity νadd of 1.7 × 104 cm2 s−1 during the poMS. The red line indicates a model with an additional viscosity νadd = 1.7 × 104 cm2 s−1 during the whole evolution. All these models are computed without braking of the surface by magnetized winds. The green lines correspond to the same models as the black line except for the inclusion of surface magnetic braking: dashed, continuous, and dotted lines correspond to a braking constant K equal to 1, 1/2, and 1/3 of its solar-calibrated value, respectively. The red dot indicates the ratio of core to surface rotation rates determined for star B by Deheuvels et al. (2014).
Current usage metrics show cumulative count of Article Views (full-text article views including HTML views, PDF and ePub downloads, according to the available data) and Abstracts Views on Vision4Press platform.
Data correspond to usage on the plateform after 2015. The current usage metrics is available 48-96 hours after online publication and is updated daily on week days.
Initial download of the metrics may take a while.