Fig. 2
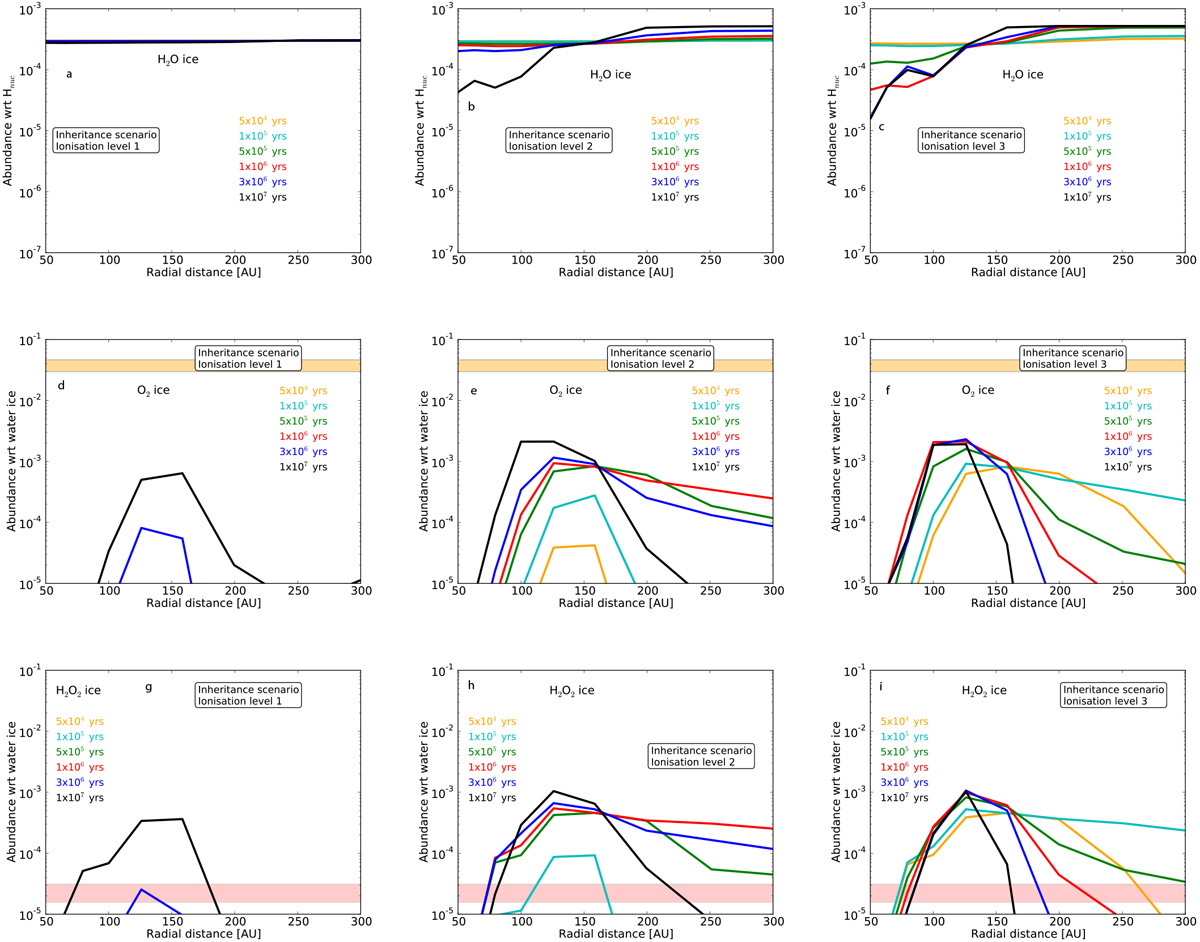
Radial abundance profiles for the inheritance scenario at multiple evolutionary time steps. Top to bottom panels: H2O, O2, and H2O2. Left to right panels: increasing ionisation levels. For O2 and H2O2, the limits detected in comet 67P are indicated as yellow and red shaded areas, respectively. The chemical network utilised does not include O3 chemistry.
Current usage metrics show cumulative count of Article Views (full-text article views including HTML views, PDF and ePub downloads, according to the available data) and Abstracts Views on Vision4Press platform.
Data correspond to usage on the plateform after 2015. The current usage metrics is available 48-96 hours after online publication and is updated daily on week days.
Initial download of the metrics may take a while.