Fig. A.3
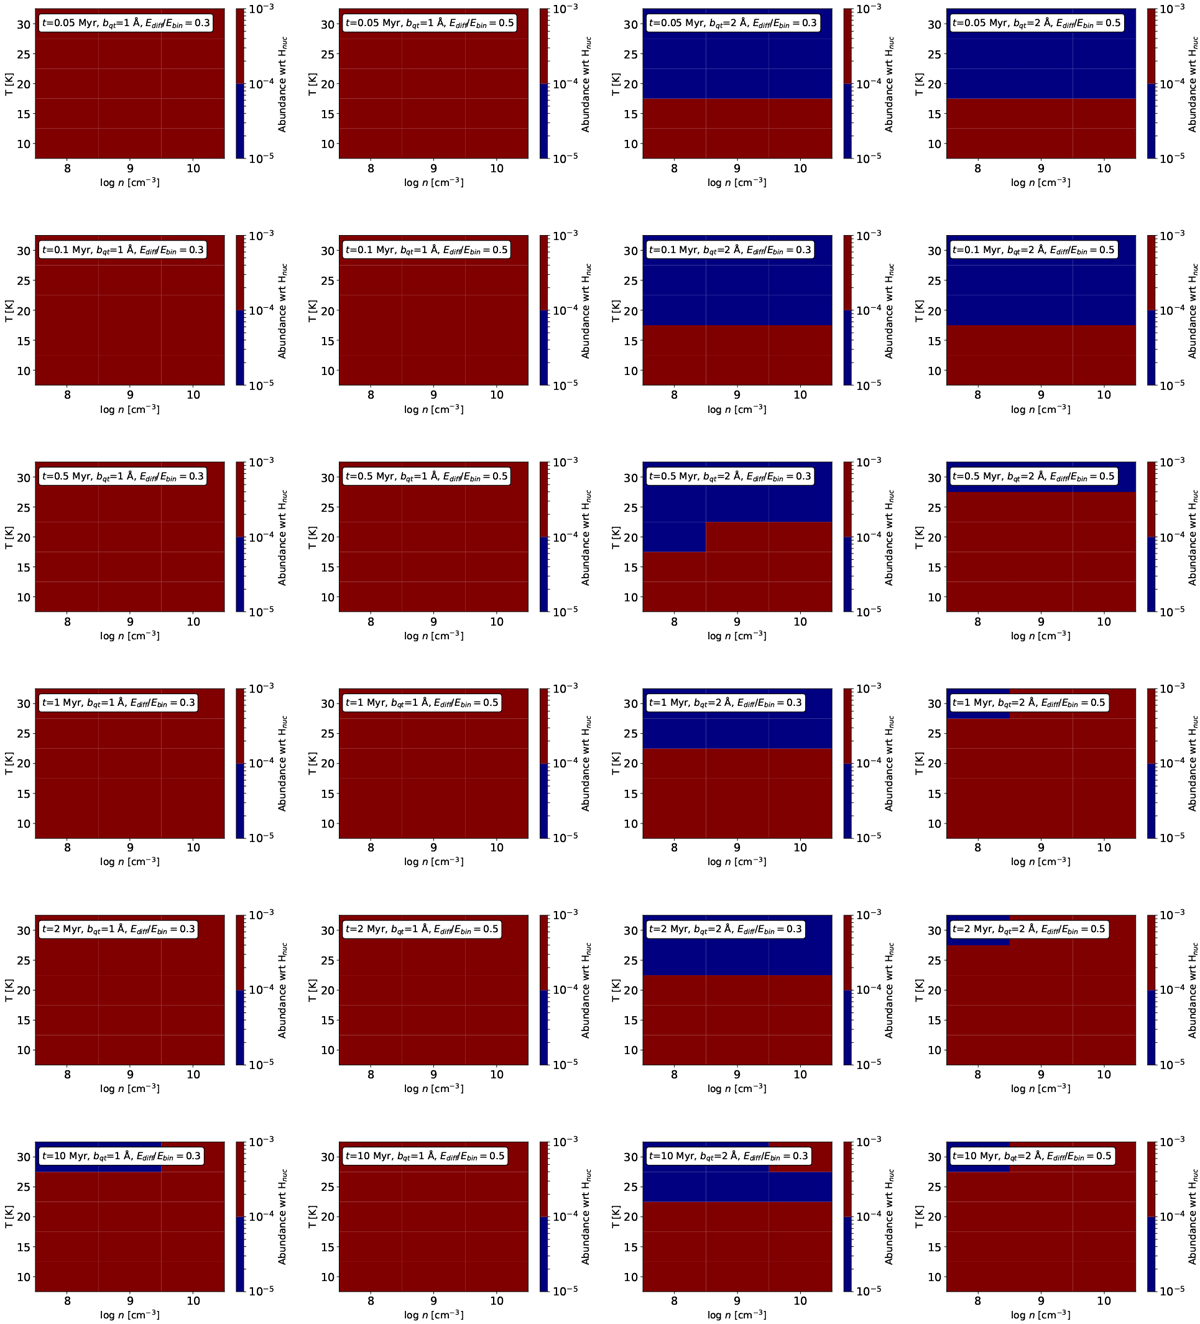
Abundances (given as colours) for H2O ice as function of midplane density (x-axes), and temperature (y-axes) at different evolutionary steps for the reset scenario. From left to right panels: abundances from model runs with different parameters for grain–surface reactions: Cols. 1 and 2: bqt = 1 Å, Cols. 3 and 4: bqt = 1 Å, Cols. 1 and 3: with Ediff∕Ebin = 0.3, and Cols. 2 and 4: with Ediff∕Ebin = 0.5. From top to bottom panels: different evolutionary times, from 0.05 Myr (top) to 10 Myr (bottom). To the right of each plot is a colourbar, indicating the abundance level with respect to Hnuc for each colour. The chemical network utilised includes O3 chemistry.
Current usage metrics show cumulative count of Article Views (full-text article views including HTML views, PDF and ePub downloads, according to the available data) and Abstracts Views on Vision4Press platform.
Data correspond to usage on the plateform after 2015. The current usage metrics is available 48-96 hours after online publication and is updated daily on week days.
Initial download of the metrics may take a while.