Fig. 3.
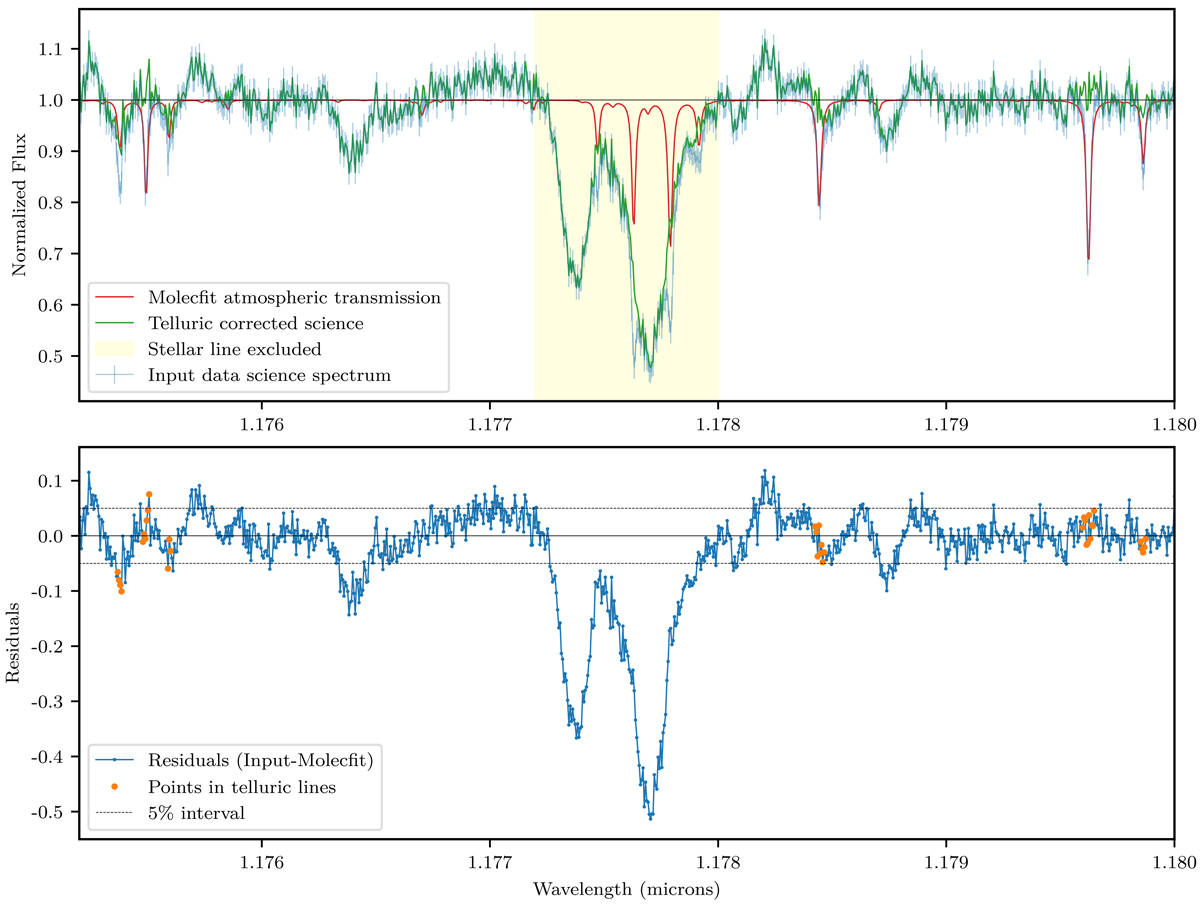
Example of a telluric-corrected spectrum with Molecfit. Top panel: input spectrum of the target star is indicated in blue, Molecfit atmospheric transmission is shown in red, corrected spectrum is shown in green. Excluded stellar lines are shown in light yellow. Bottom panel: residuals between the input spectrum and atmospheric transmission. The dashed lines represent the upper and lower 5% limits. The points that belong to telluric lines and are not blended with stellar lines are identified in orange.
Current usage metrics show cumulative count of Article Views (full-text article views including HTML views, PDF and ePub downloads, according to the available data) and Abstracts Views on Vision4Press platform.
Data correspond to usage on the plateform after 2015. The current usage metrics is available 48-96 hours after online publication and is updated daily on week days.
Initial download of the metrics may take a while.