Free Access
Fig. 2.
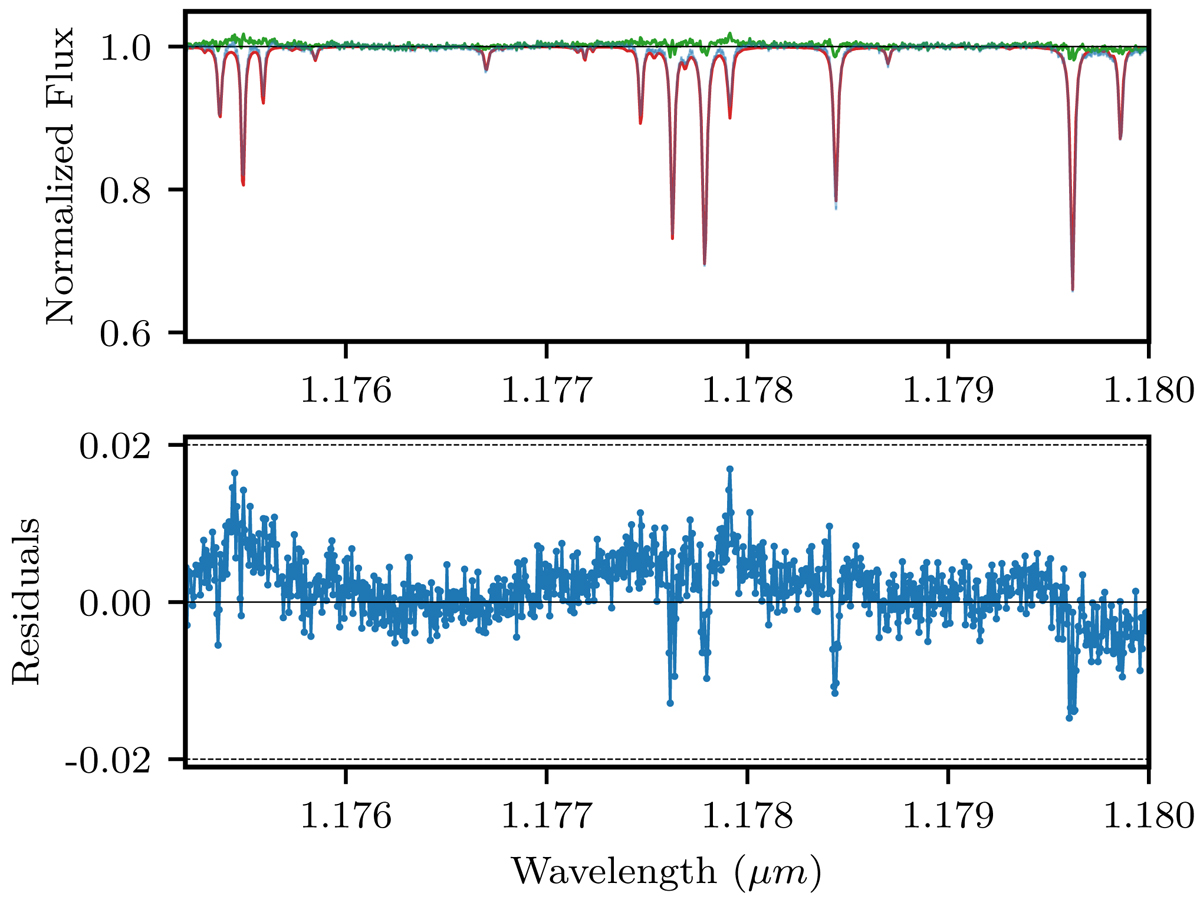
Standard star spectrum corrected with Molecfit. Top panel: input spectrum is indicated in blue, Molecfit atmospheric transmission is indicated in red, corrected spectrum is indicated in green. Bottom panel: residuals obtained after the subtraction of the atmospheric transmission to the input spectrum.
Current usage metrics show cumulative count of Article Views (full-text article views including HTML views, PDF and ePub downloads, according to the available data) and Abstracts Views on Vision4Press platform.
Data correspond to usage on the plateform after 2015. The current usage metrics is available 48-96 hours after online publication and is updated daily on week days.
Initial download of the metrics may take a while.