Free Access
Fig. 1.
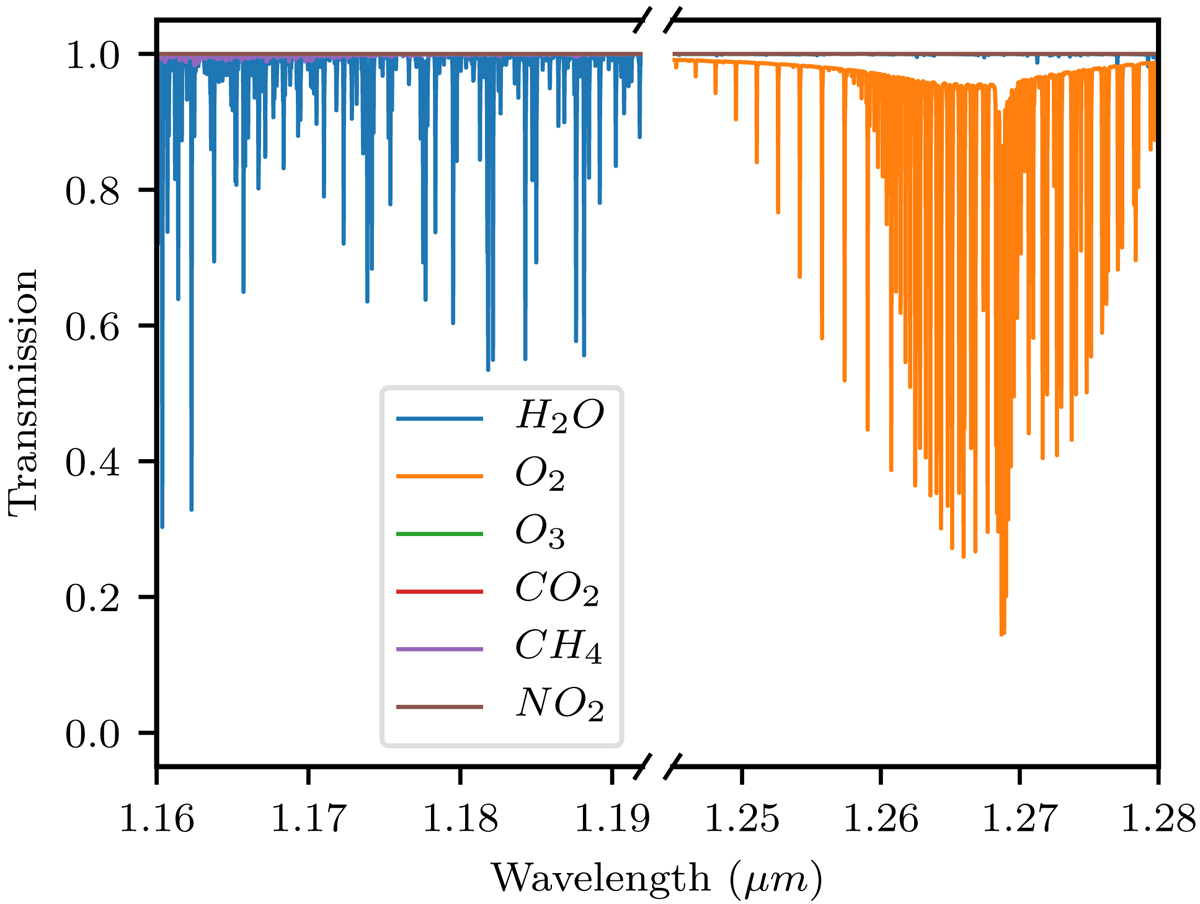
Synthetic transmission spectrum of our atmosphere calculated with the LBLRTM through the TAPAS interface. The main absorber in the first wavelength range is H2O (blue line), while in the second range it is O2 (orange line). The other molecules have a transmission very close to 1.
Current usage metrics show cumulative count of Article Views (full-text article views including HTML views, PDF and ePub downloads, according to the available data) and Abstracts Views on Vision4Press platform.
Data correspond to usage on the plateform after 2015. The current usage metrics is available 48-96 hours after online publication and is updated daily on week days.
Initial download of the metrics may take a while.