Fig. 8.
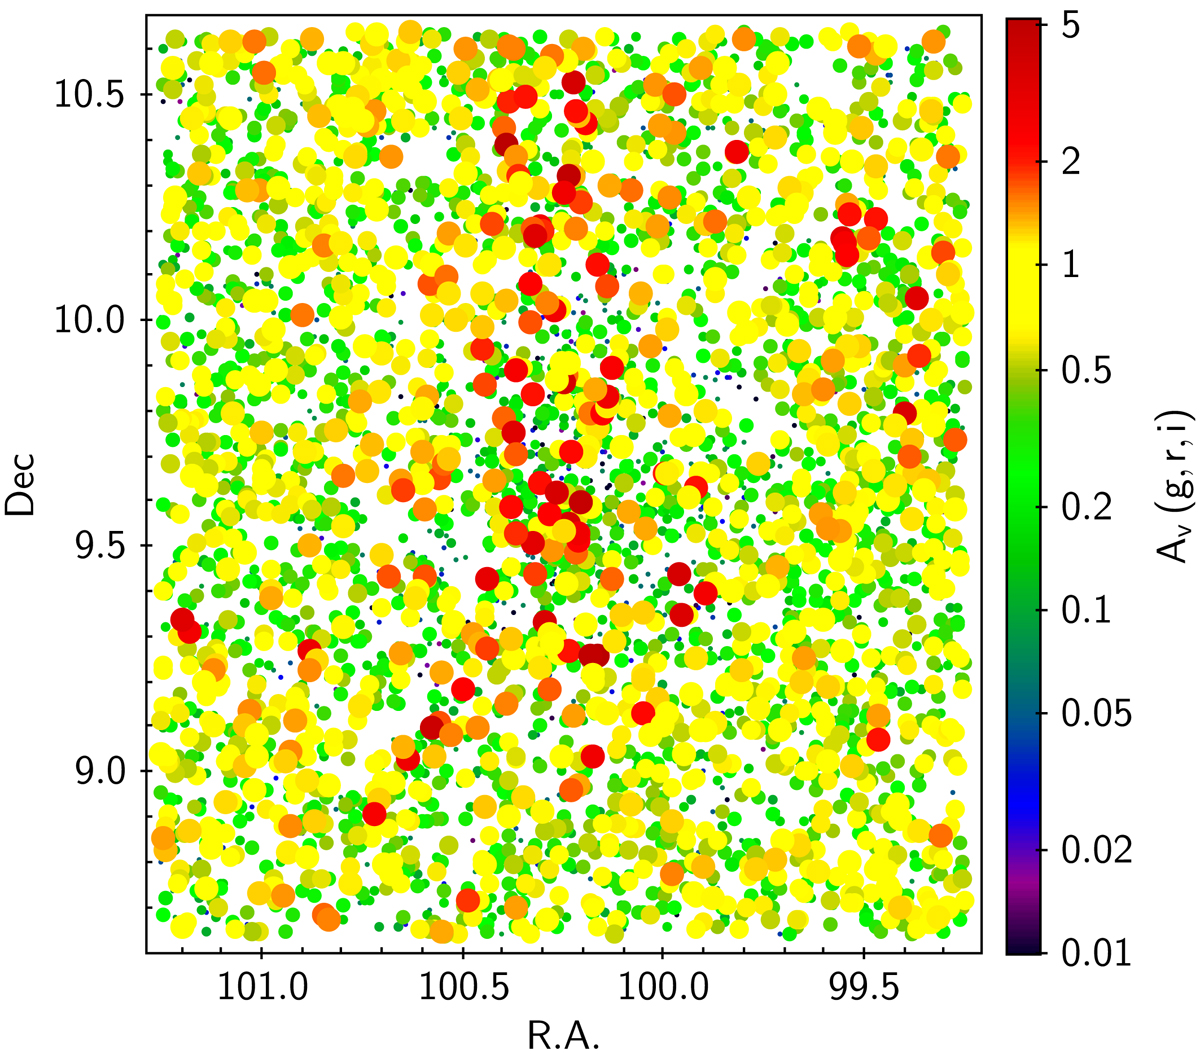
Spatial map of M-type stars selected from the (r − i, g − r) diagram as a function of their measured AV. The color of the symbols varies with AV as shown on the side axis of the diagram. The size of the symbols is scaled with AV in five groups: AV < 0.1 (smallest dots); 0.1 ≤ AV < 0.2; 0.2 ≤ AV < 0.5; 0.5 ≤ AV < 1; AV ≥ 1 (largest dots).
Current usage metrics show cumulative count of Article Views (full-text article views including HTML views, PDF and ePub downloads, according to the available data) and Abstracts Views on Vision4Press platform.
Data correspond to usage on the plateform after 2015. The current usage metrics is available 48-96 hours after online publication and is updated daily on week days.
Initial download of the metrics may take a while.