Fig. 7.
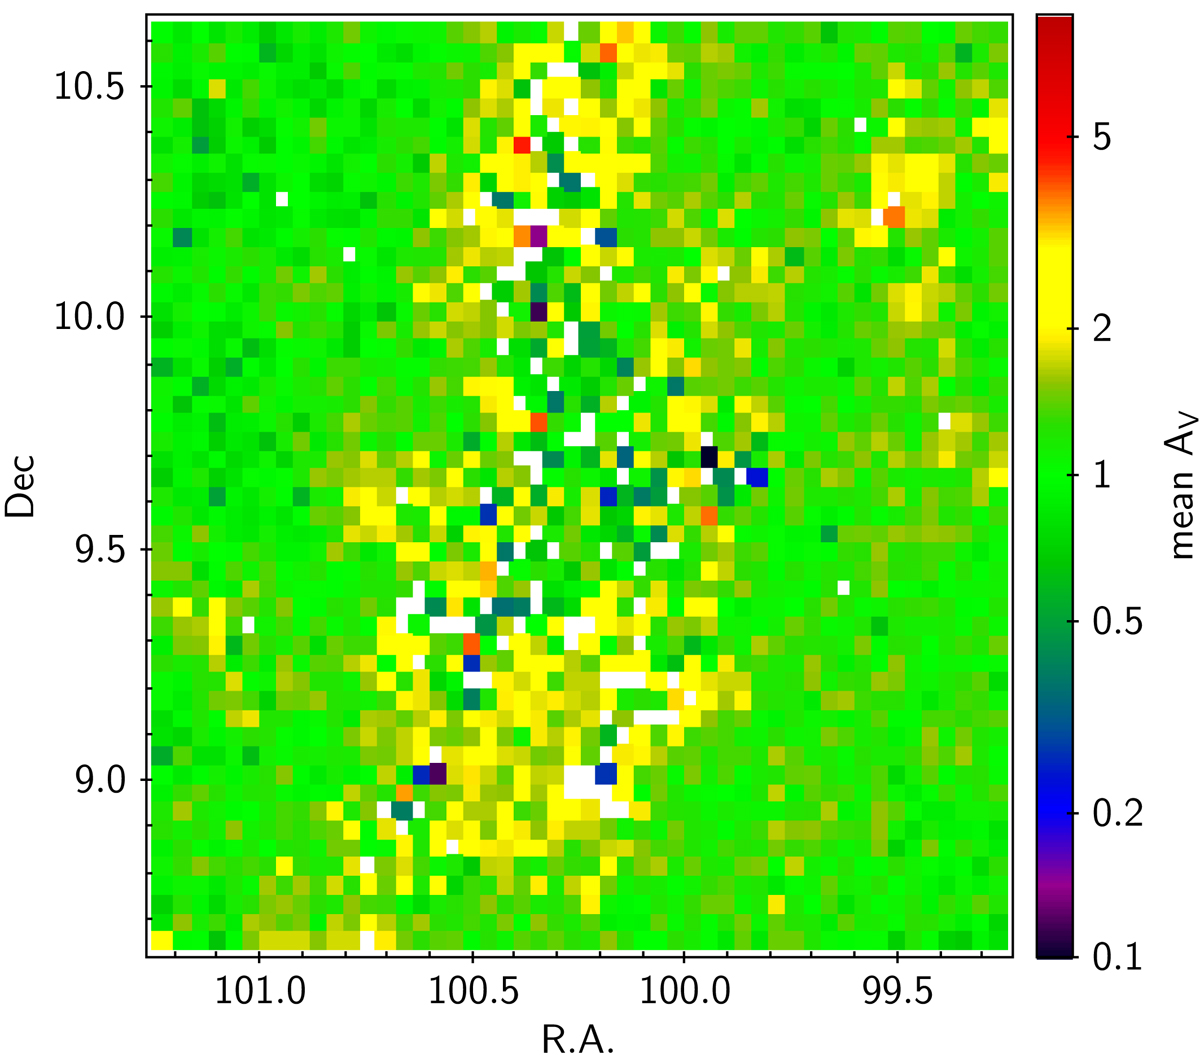
Map of the average AV measured for M-type stars across the region. Each of the 2500 2.4′ × 2.4′ boxes that constitute the map is colored according to the mean AV computed across the population of M-type stars projected onto that box. The reference color–AV scale used is shown in the side axis. Colors are assigned only to boxes containing at least two M-stars in our sample, and with an internal spread in AV that is no more than 3σ larger than the typical dispersion in AV measured among boxes containing the same number of sources within the map.
Current usage metrics show cumulative count of Article Views (full-text article views including HTML views, PDF and ePub downloads, according to the available data) and Abstracts Views on Vision4Press platform.
Data correspond to usage on the plateform after 2015. The current usage metrics is available 48-96 hours after online publication and is updated daily on week days.
Initial download of the metrics may take a while.