Fig. 4.
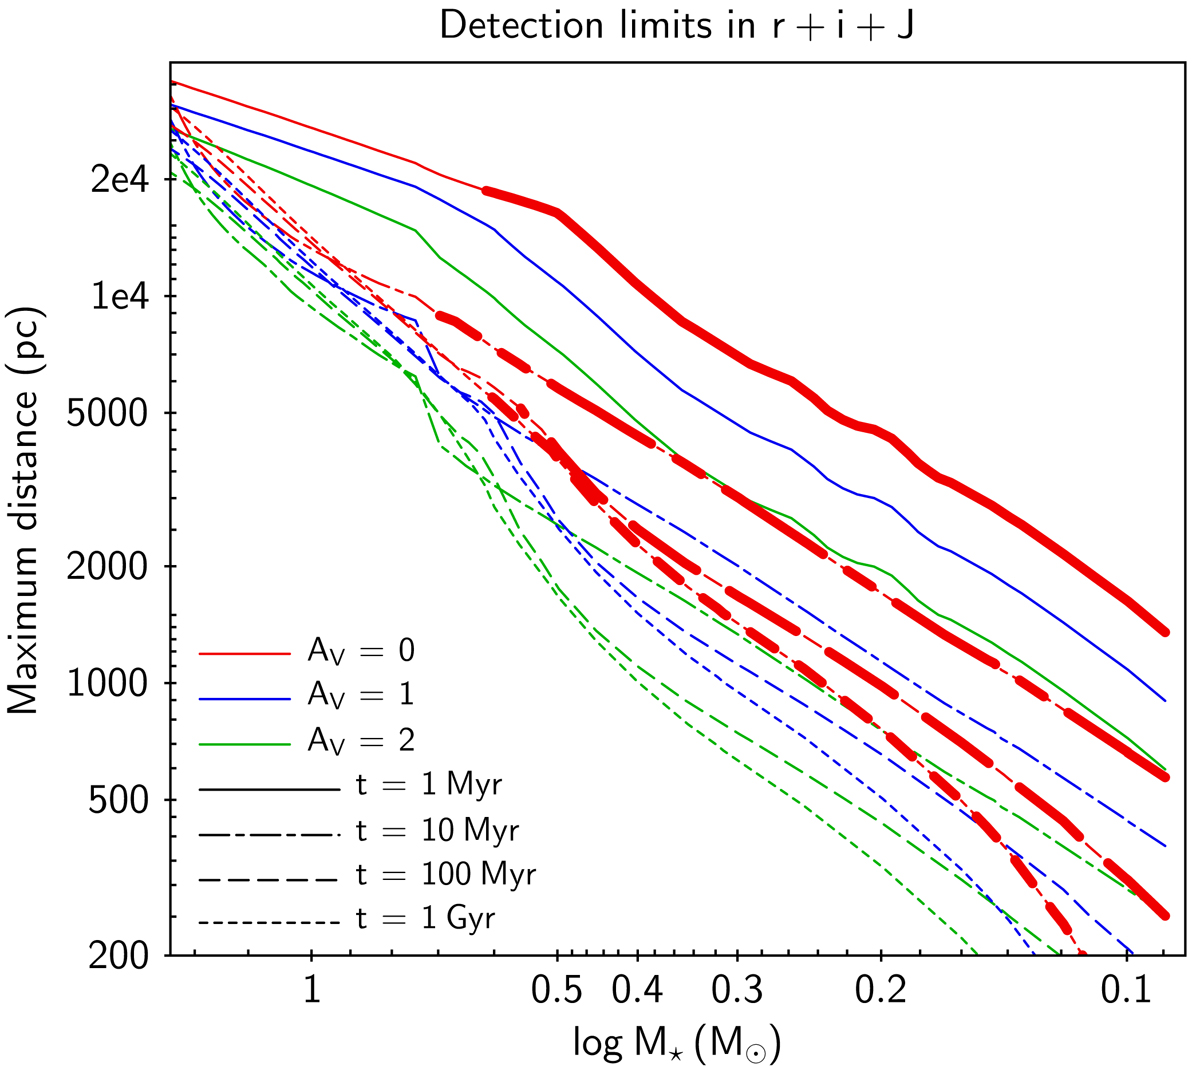
Maximum distance at which simultaneous r, i, J detection in our catalog is expected for stars aged 1 Myr (solid line), 10 Myr (dash-dotted line), 100 Myr (dashed line), or 1 Gyr (dotted line), as a function of their AV (red = 0, blue = 1, green = 2) and mass. The curves were built by taking the absolute r, i, J magnitudes predicted for stars of different mass and age in Marigo et al.’s (2017) isochrones, and using them as calibration to convert the limiting magnitudes of our catalog (see Table 1) into limiting distances as a function of stellar mass, age, and AV. A thicker stroke marks the mass range of M-type stars (Teff < 4000 K) predicted by the models at the various ages, shown for illustration purposes on the AV = 0 curves.
Current usage metrics show cumulative count of Article Views (full-text article views including HTML views, PDF and ePub downloads, according to the available data) and Abstracts Views on Vision4Press platform.
Data correspond to usage on the plateform after 2015. The current usage metrics is available 48-96 hours after online publication and is updated daily on week days.
Initial download of the metrics may take a while.