Fig. 3.
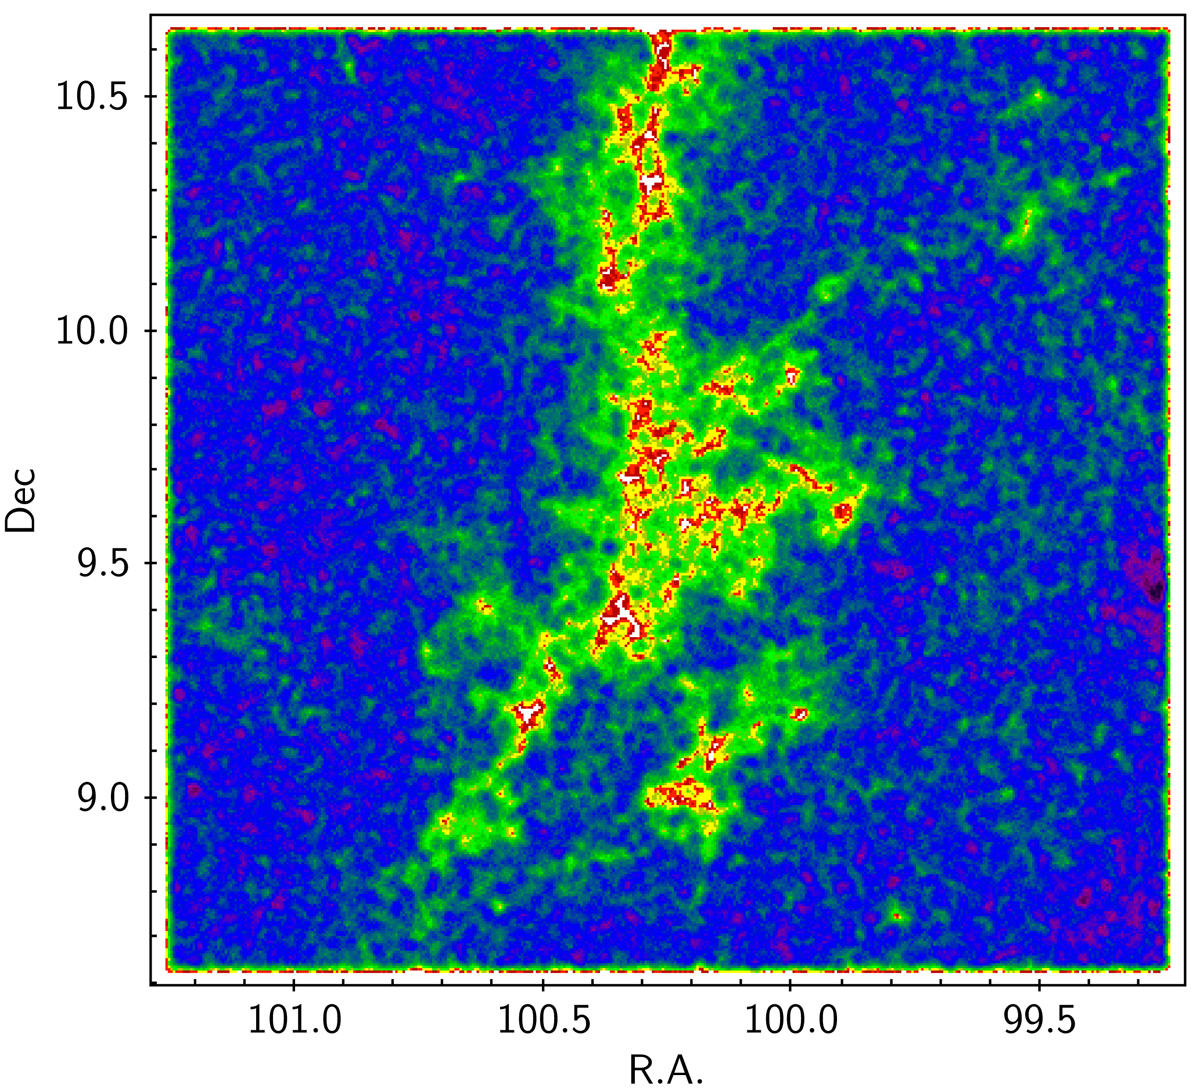
Number density map of the population of our catalog across the 2° × 2° region investigated in this study (see text). Spatial coordinates (RA and Dec) are expressed in degrees (°) in this and all subsequent diagrams. Object densities are mapped according to a “rainbow” color scale, where purple and blue correspond to the highest number density, green indicates intermediate densities, and red corresponds to the lowest number density. North is up and east is left on the diagram.
Current usage metrics show cumulative count of Article Views (full-text article views including HTML views, PDF and ePub downloads, according to the available data) and Abstracts Views on Vision4Press platform.
Data correspond to usage on the plateform after 2015. The current usage metrics is available 48-96 hours after online publication and is updated daily on week days.
Initial download of the metrics may take a while.