Fig. 22.
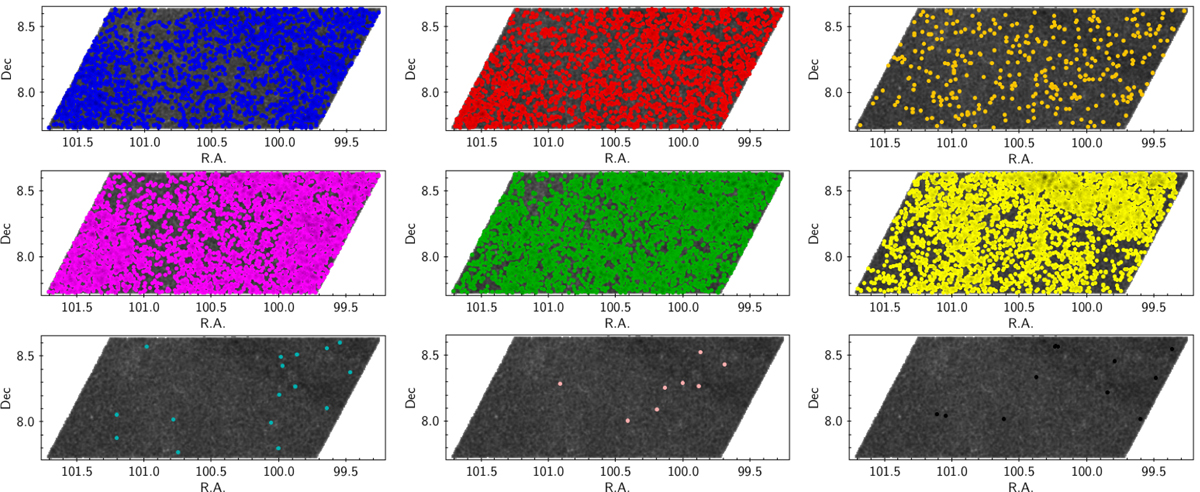
Spatial distribution for M-type stars in the control field, sorted following the scheme in Fig. 10. The upper panels, from left to right, depict AV < 0.7 stars with the same photometric properties as the lower, middle, and upper populations in Fig. 10a. Middle and lower panels are populated respectively by “field locus” and “sequence locus” stars with AV = 0.7–1.2 (left), AV = 1.2–1.7 (center), and AV ≥ 1.7 (right).
Current usage metrics show cumulative count of Article Views (full-text article views including HTML views, PDF and ePub downloads, according to the available data) and Abstracts Views on Vision4Press platform.
Data correspond to usage on the plateform after 2015. The current usage metrics is available 48-96 hours after online publication and is updated daily on week days.
Initial download of the metrics may take a while.