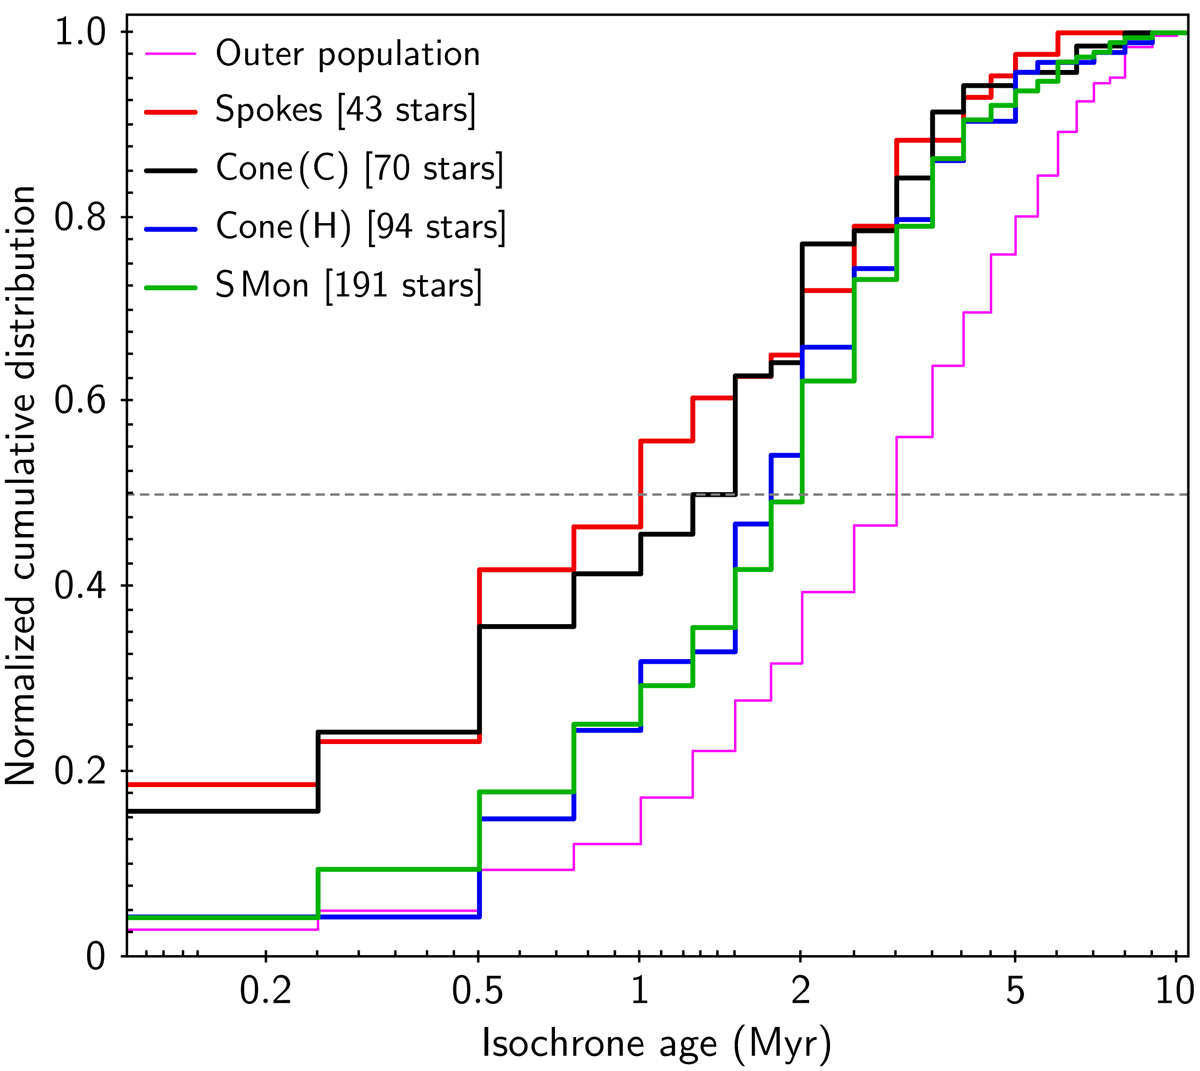
Fig. 20.

Normalized cumulative distribution in isochronal age of clustered stars from the various subregions highlighted in Fig. 19 (red = Spokes, black = Cone (C), blue = Cone (H), green = S Mon). The number of stars included in each subregion is reported between square brackets. The underlying cumulative distribution in fuchsia corresponds to the population of M-type clustered stars located outside the S Mon+Cone region. Marigo et al.’s (2017) PARSEC-COLIBRI stellar isochrones were adopted to sort our clustered population of M-type stars into age groups, using a binning of 0.25 Myr below 2 Myr, a binning of 0.5 Myr between 2 and 8 Myr, and a binning of 1 Myr for later ages. The gray dotted line indicates the position of the median value in each cumulative distribution.
Current usage metrics show cumulative count of Article Views (full-text article views including HTML views, PDF and ePub downloads, according to the available data) and Abstracts Views on Vision4Press platform.
Data correspond to usage on the plateform after 2015. The current usage metrics is available 48-96 hours after online publication and is updated daily on week days.
Initial download of the metrics may take a while.


