Fig. 19.
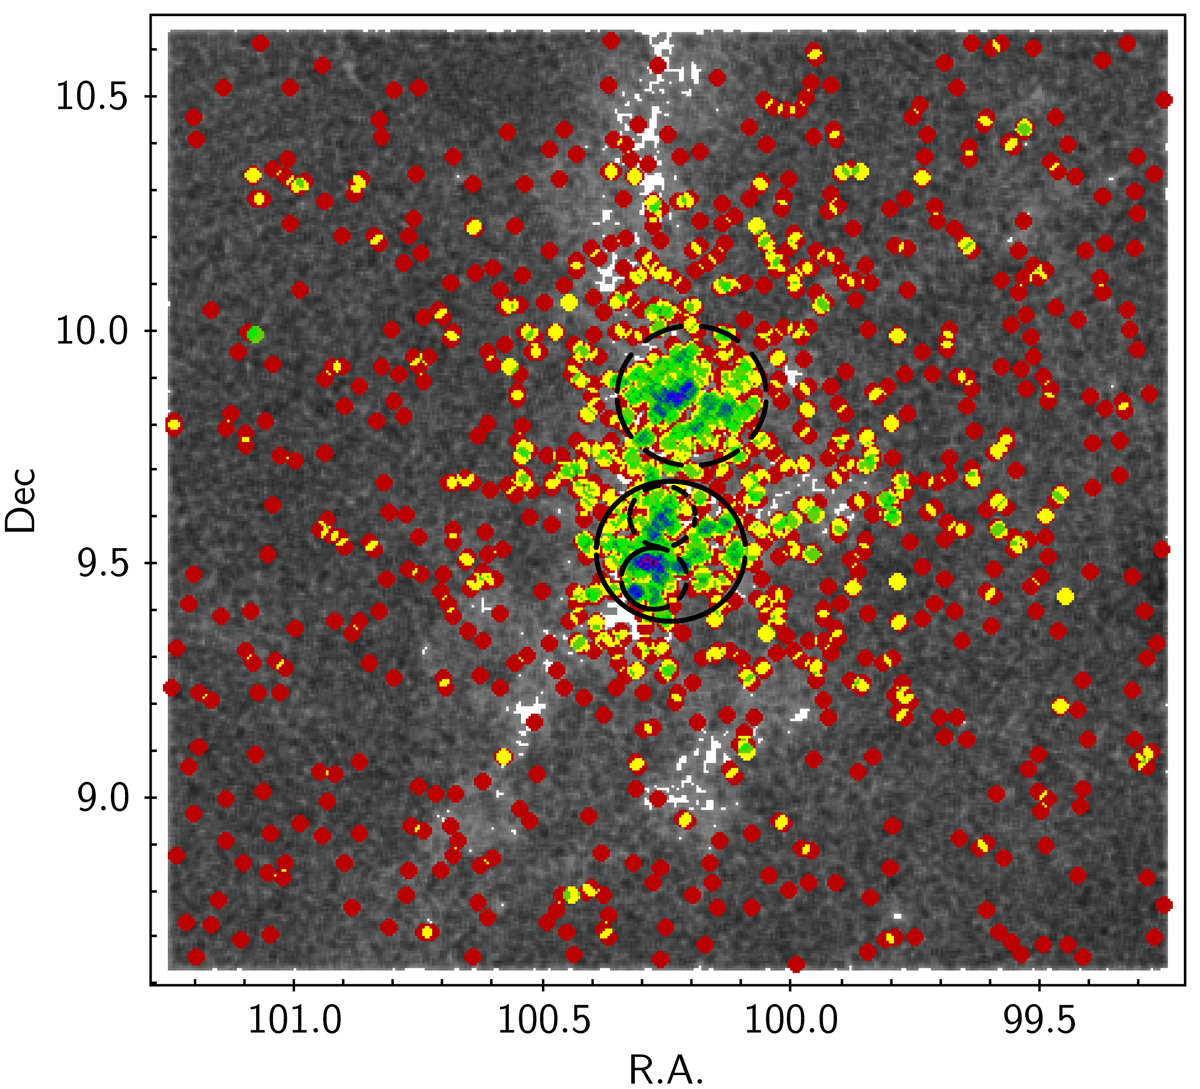
Spatial density map of the clustered population identified in this study (see Fig. 16 and Sect. 3.3.2), with contours indicating the NGC 2264 subregions defined in Sung et al. (2008, 2009): the S Mon subregion (dashed line), the Cone subregion (Cone (H), solid line), the Spokes subcluster (upper contour inside the Cone subregion), and the Cone core (Cone (C), lower contour inside the Cone subregion).
Current usage metrics show cumulative count of Article Views (full-text article views including HTML views, PDF and ePub downloads, according to the available data) and Abstracts Views on Vision4Press platform.
Data correspond to usage on the plateform after 2015. The current usage metrics is available 48-96 hours after online publication and is updated daily on week days.
Initial download of the metrics may take a while.