Fig. 16.
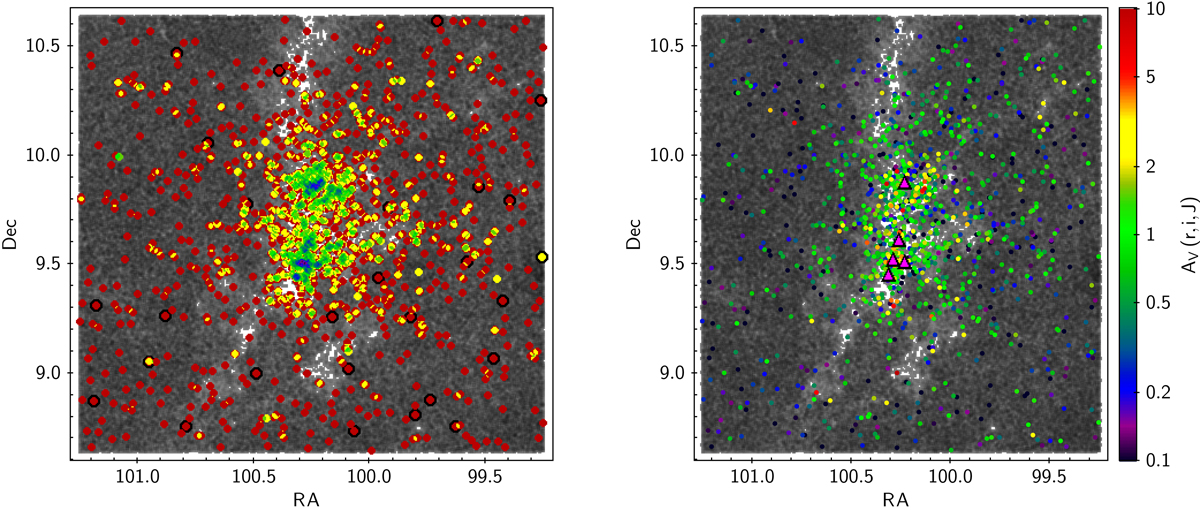
Left panel: spatial density map of the clustered population extracted from Fig. 10, overplotted to the map of the complete catalog population (gray dots). Colors progress with local number density of objects from red (lowest) to blue/purple (highest) following a rainbow scale. Points encircled in black are possible giant contaminants (see Sect. 4.1). Right panel: AV distribution of objects highlighted in the left panel, after removing the giant contaminants. Colors are scaled according to AV as shown in the side axis. The field population is shown in gray in the background. Fuchsia triangles mark the locations with the highest density of objects from the clustered population (in blue on the left panel diagram).
Current usage metrics show cumulative count of Article Views (full-text article views including HTML views, PDF and ePub downloads, according to the available data) and Abstracts Views on Vision4Press platform.
Data correspond to usage on the plateform after 2015. The current usage metrics is available 48-96 hours after online publication and is updated daily on week days.
Initial download of the metrics may take a while.