Fig. 15.
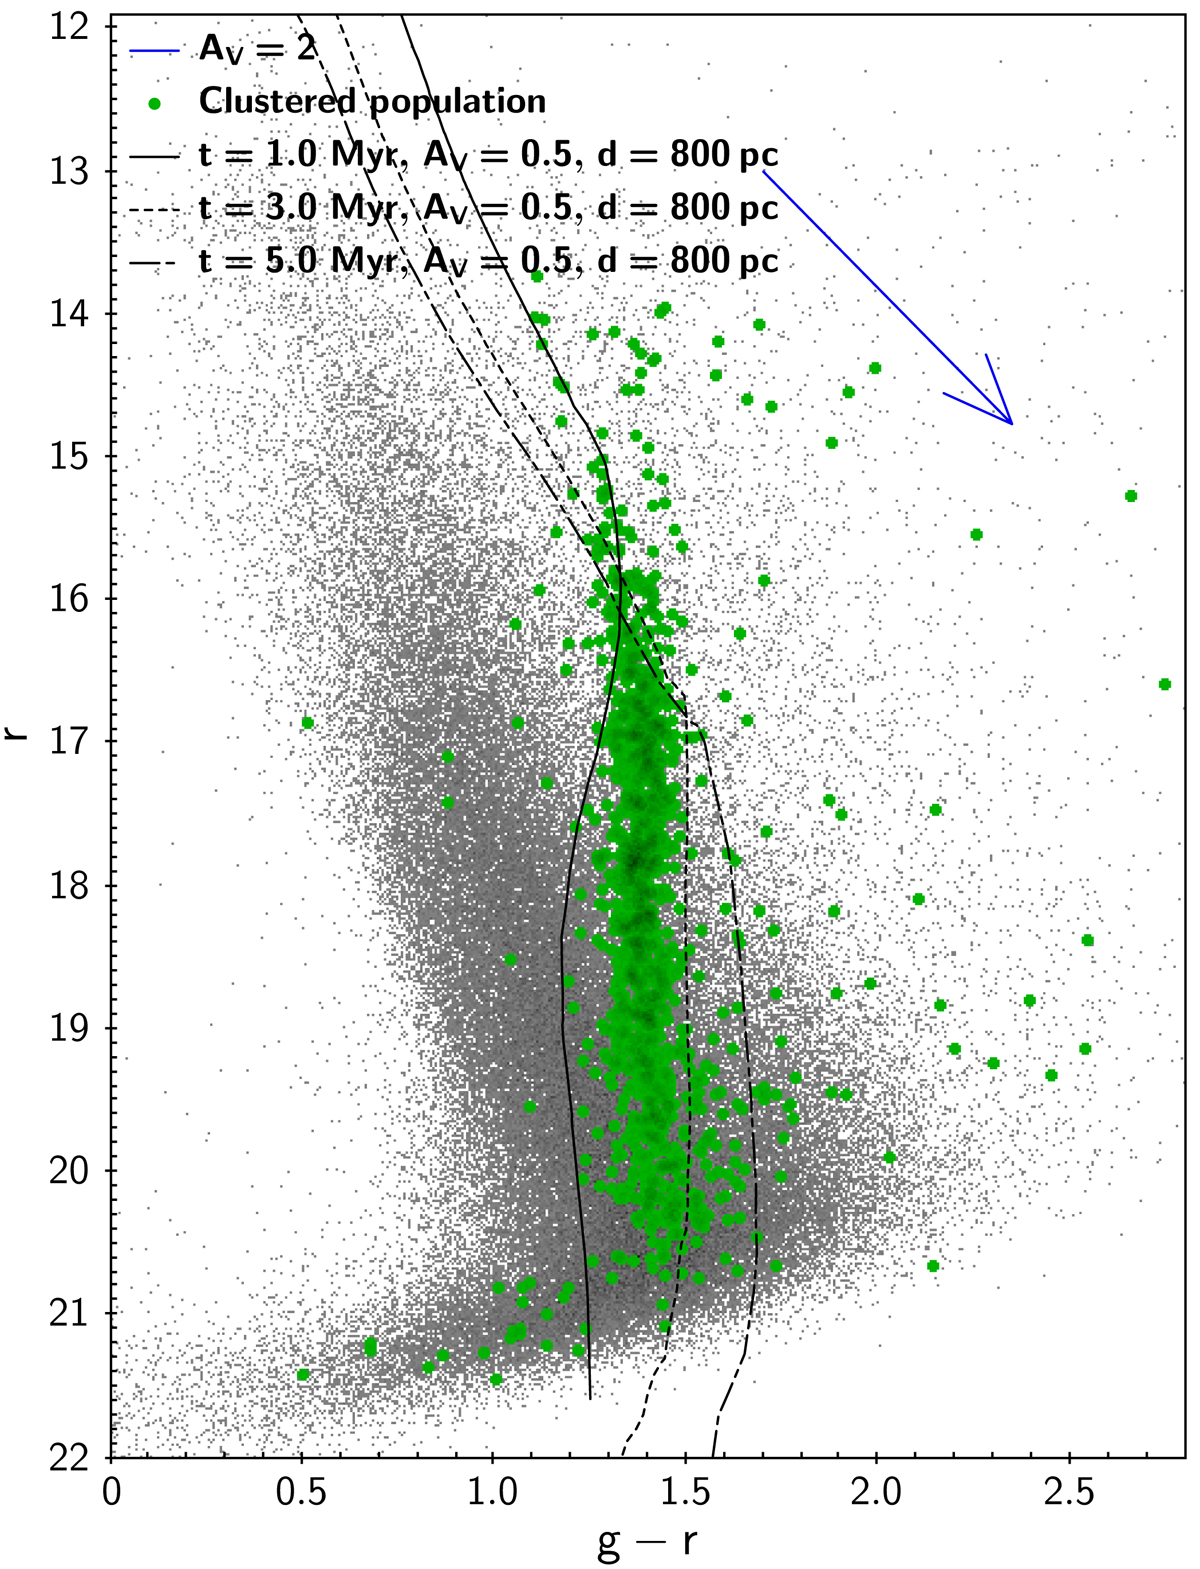
Field locus on the r versus g − r diagram (gray). The sequence traced by the clustered population, extracted as described in Sect. 3.2, is highlighted in green. The 1 Myr, 3 Myr, and 5 Myr model isochrones from Marigo et al. (2017), brought to a distance of 800 pc and reddened by an amount corresponding to AV = 0.5 (typical AV measured for sources in the clustered population), are overlaid on the diagram.
Current usage metrics show cumulative count of Article Views (full-text article views including HTML views, PDF and ePub downloads, according to the available data) and Abstracts Views on Vision4Press platform.
Data correspond to usage on the plateform after 2015. The current usage metrics is available 48-96 hours after online publication and is updated daily on week days.
Initial download of the metrics may take a while.