Fig. 14.
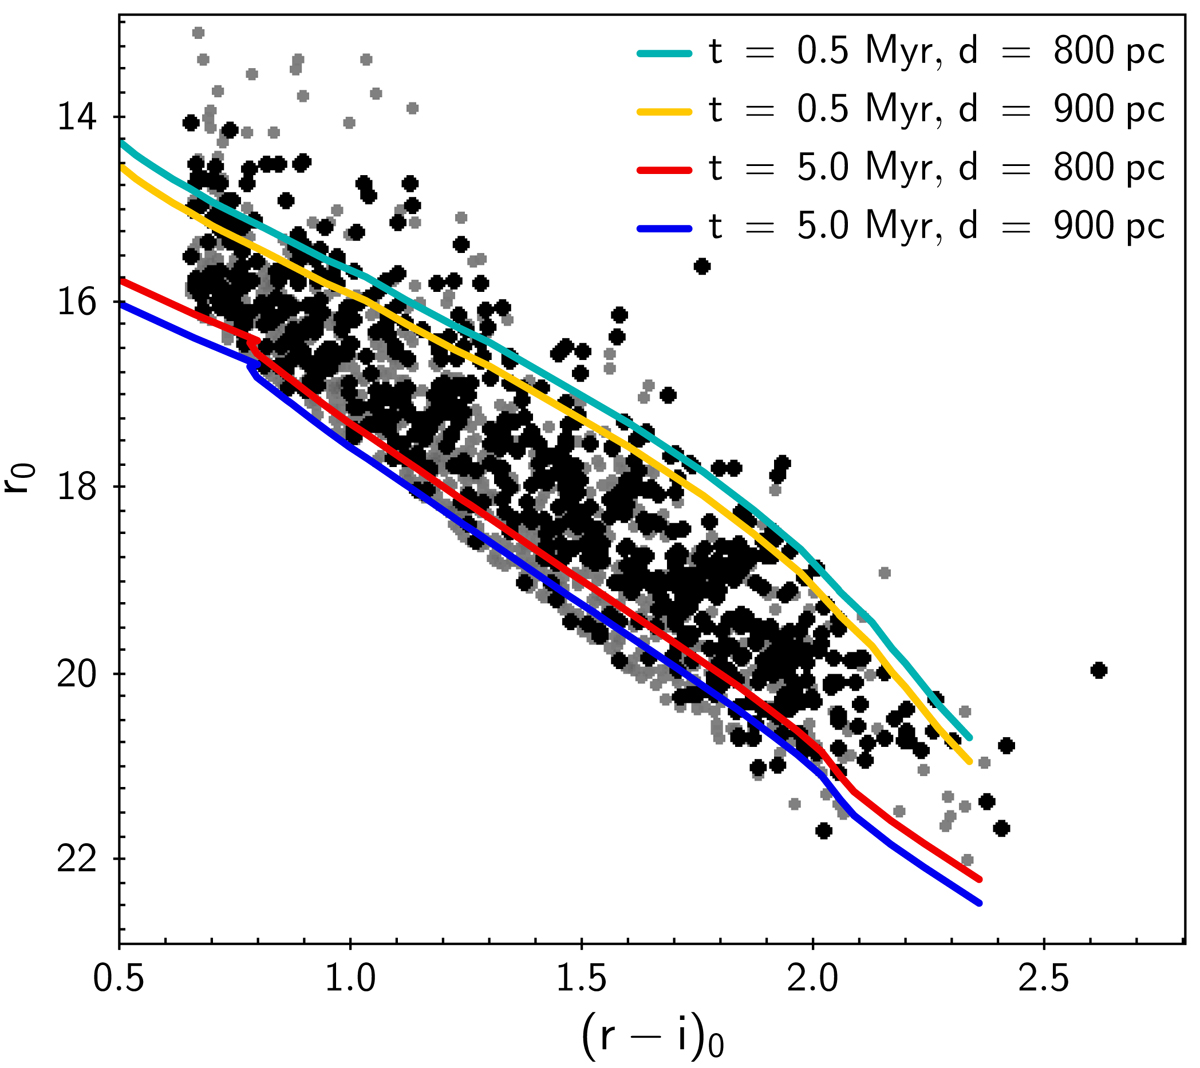
Dereddened r-band photometry and r – i colors for M-type stars that fall into the clustered population locus (i.e., above the red line) on the diagrams shown in Fig. 10 (left panels). Sources extracted from the photometric clustered population locus and spatially projected onto the central part of the field are highlighted further as black points. The 0.5 Myr and 5 Myr PMS model isochrones from Marigo et al. (2017), brought to a distance of 800–900 pc, are overplotted to the datapoint distribution to mark a tentative age range for the clustered population.
Current usage metrics show cumulative count of Article Views (full-text article views including HTML views, PDF and ePub downloads, according to the available data) and Abstracts Views on Vision4Press platform.
Data correspond to usage on the plateform after 2015. The current usage metrics is available 48-96 hours after online publication and is updated daily on week days.
Initial download of the metrics may take a while.