Free Access
Fig. 13.
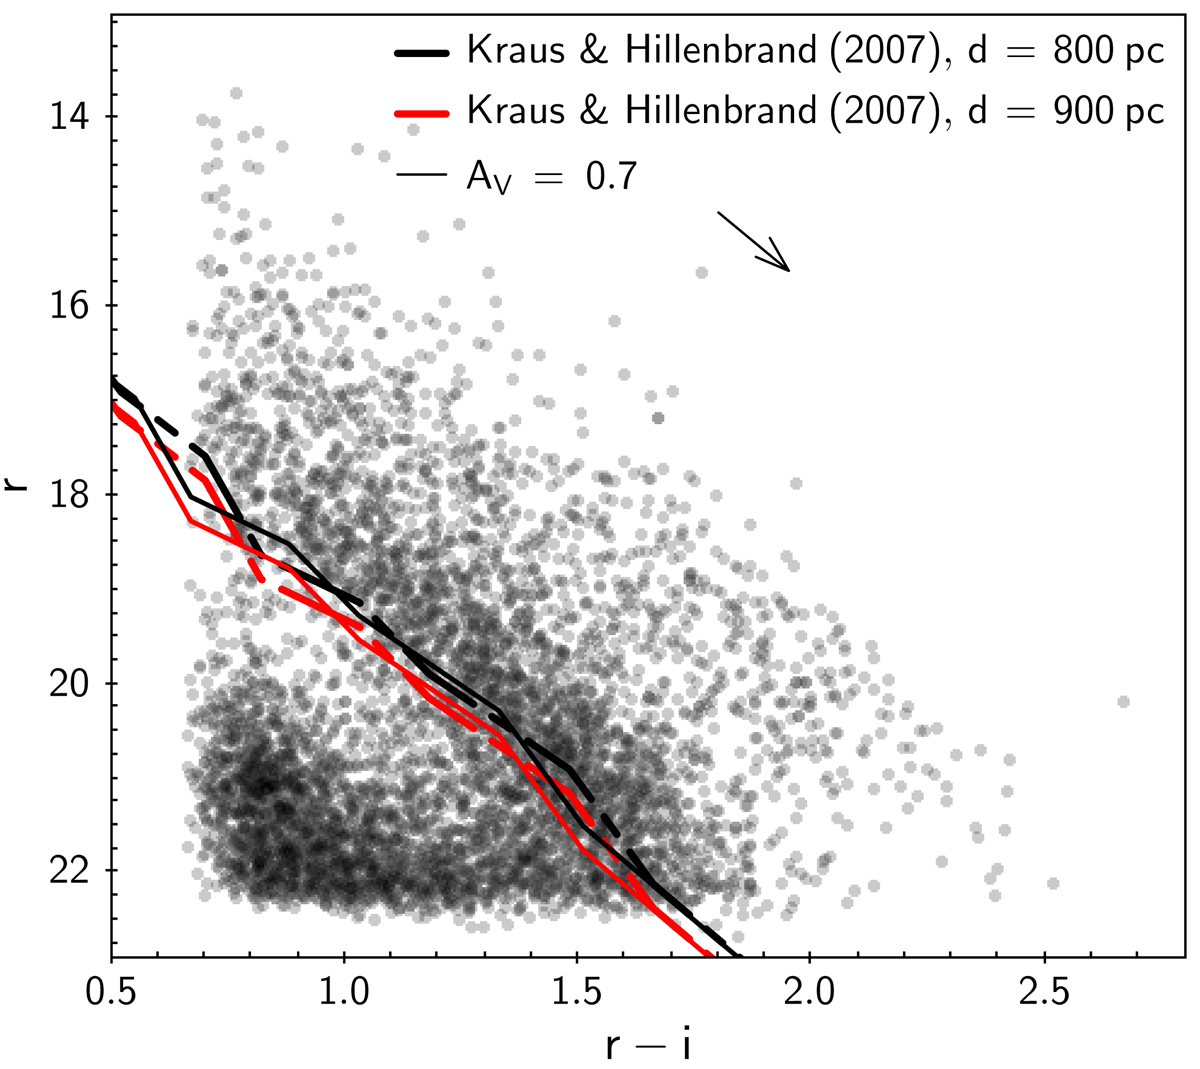
Same diagram as in Fig. 10a, with a superimposed color-magnitude sequence for dwarfs extracted from Kraus & Hillenbrand (2007), brought to a distance of 800 pc (black) and 900 pc (red), assuming AV = 0 (solid line) or AV = 0.7 (dash-dotted line), to reproduce the lower envelope of the foreground stars locus on the diagram.
Current usage metrics show cumulative count of Article Views (full-text article views including HTML views, PDF and ePub downloads, according to the available data) and Abstracts Views on Vision4Press platform.
Data correspond to usage on the plateform after 2015. The current usage metrics is available 48-96 hours after online publication and is updated daily on week days.
Initial download of the metrics may take a while.