Fig. 12.
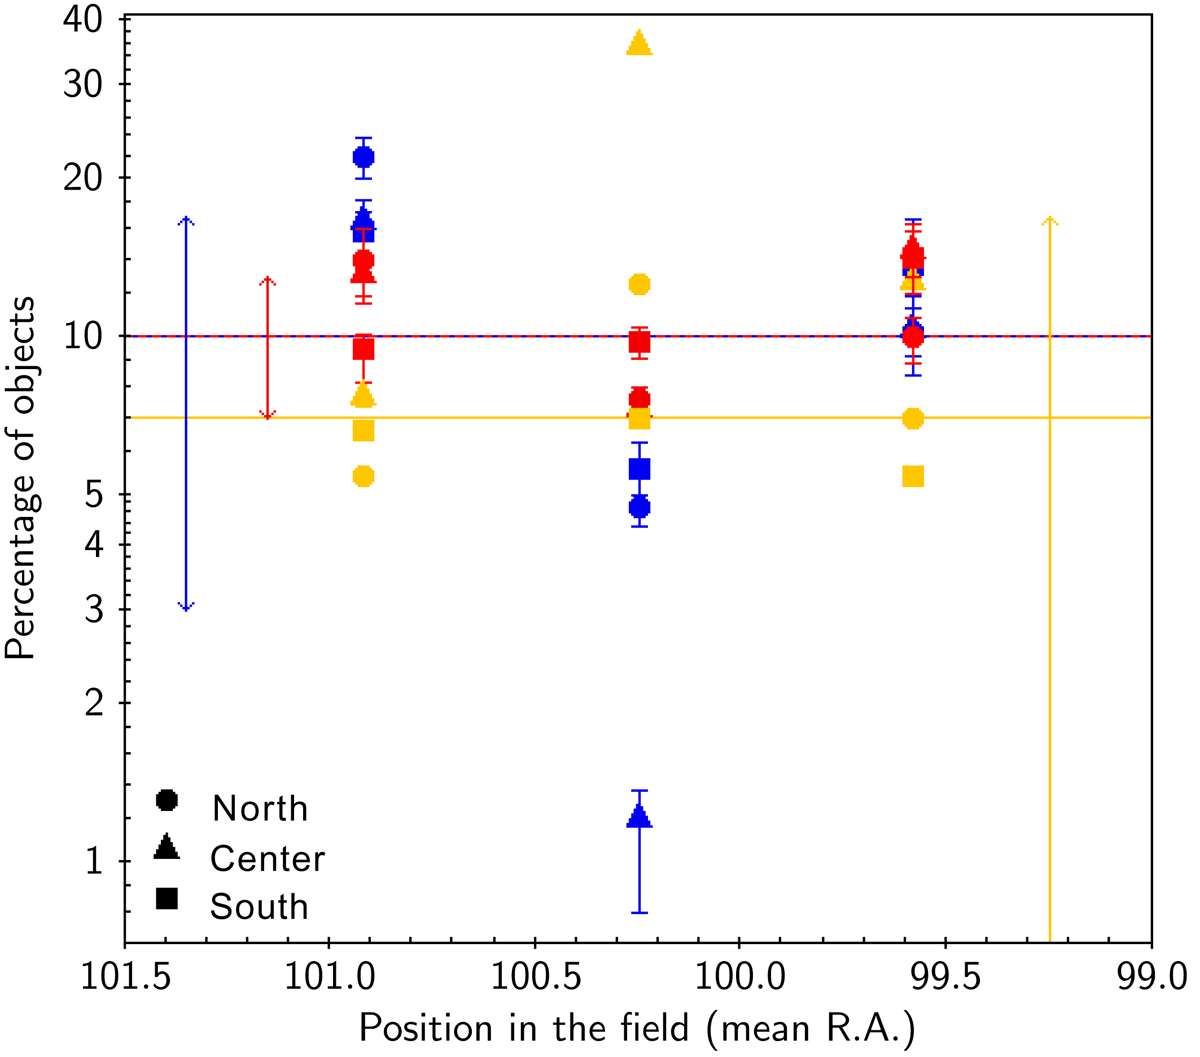
Percentage of objects from each of the three subpopulations extracted from Fig. 10a that falls into each of the nine subfields defined within our region (see text). Following the color convention in Figs. 10 and 11, blue symbols refer to the lower population from Fig. 10a (below the blue dashed line), red symbols refer to the intermediate population from Fig. 10a (between the blue dashed line and the red dotted line), and yellow symbols refer to the upper population from Fig. 10a (above the red dotted line). The x-axis coordinates correspond to the mean RA position of the subfield from which the corresponding percentages were extracted. The shape of the symbols identifies the Dec coordinate of the subfield from where the corresponding percentages were extracted: circle for subfields in the northern part of the region (mean Dec = 10.3056°), triangle for subfields in the central part of the region (mean Dec = 9.6389°), and square for subfields in the southern part of the region (mean Dec = 8.9722°). Error bars associated with the percentage values take into account the photometric uncertainties on datapoints in Fig. 10a, which may determine individual objects to shift from one area to the neighboring one on the diagram. Horizontal lines mark the median percentage of objects from each of the three subpopulations in Fig. 10a across the nine subfields; the double arrows mark the dispersion of values around the typical percentage (i.e., the extent of the spatial variation in the distribution of objects from the corresponding subpopulation across the field).
Current usage metrics show cumulative count of Article Views (full-text article views including HTML views, PDF and ePub downloads, according to the available data) and Abstracts Views on Vision4Press platform.
Data correspond to usage on the plateform after 2015. The current usage metrics is available 48-96 hours after online publication and is updated daily on week days.
Initial download of the metrics may take a while.