Fig. 7.
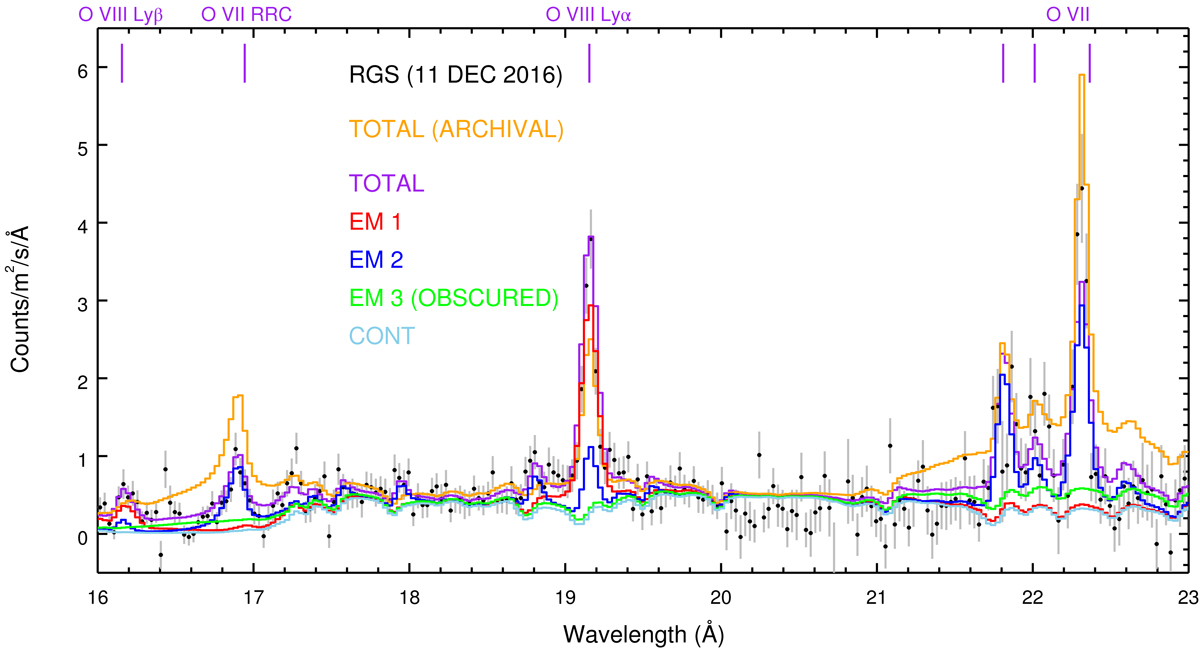
Best fit to the 17–24 Å RGS spectrum (in the observed frame) of NGC 3783 from 11 December 2016. The best-fit model with contributions from all emission components is shown in purple. Contributions from individual emission components are color-coded, with red and blue for narrow emission features and green for broad emission features. The orange solid line is a calculation using the best-fit parameters obtained from the time-averaged archival spectrum for all three emission components. Due to the obscuration effect, the broad emission component (EM 3) appears to be weaker in December 2016.
Current usage metrics show cumulative count of Article Views (full-text article views including HTML views, PDF and ePub downloads, according to the available data) and Abstracts Views on Vision4Press platform.
Data correspond to usage on the plateform after 2015. The current usage metrics is available 48-96 hours after online publication and is updated daily on week days.
Initial download of the metrics may take a while.