Free Access
Fig. 3.
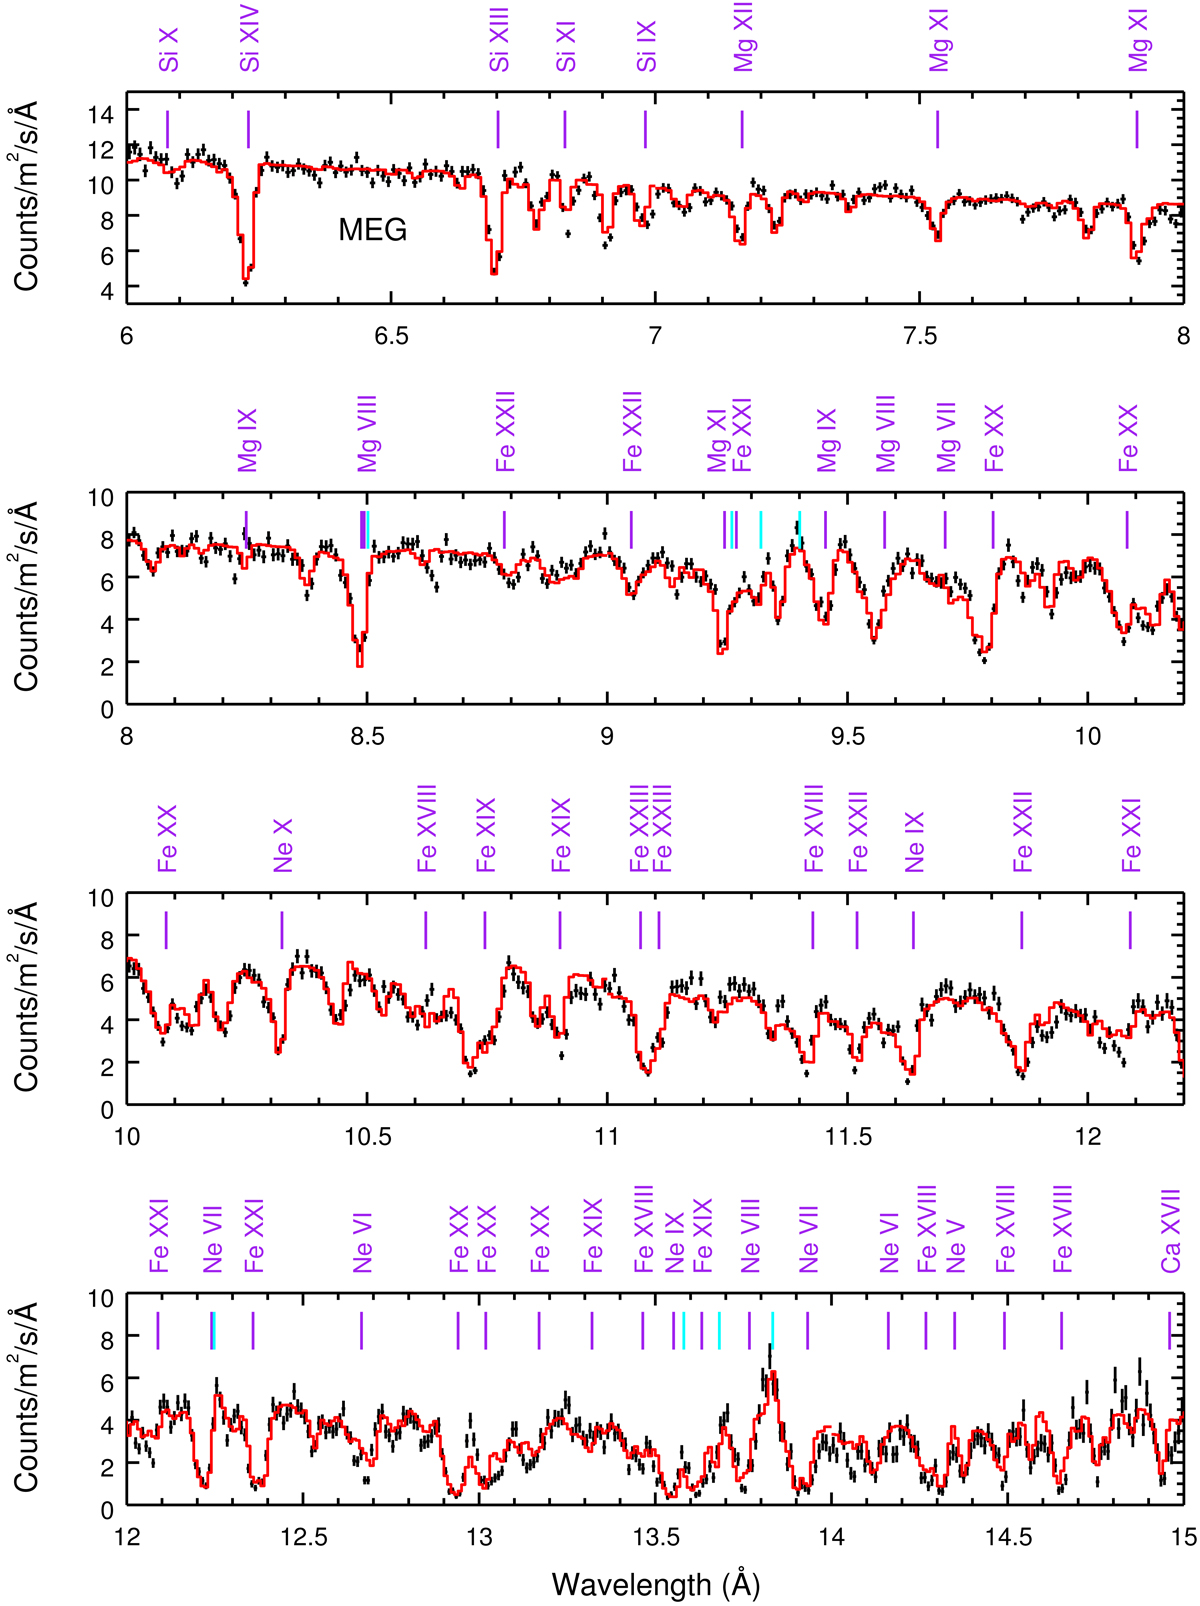
Best fit to the time-averaged MEG spectrum (in the observed frame) of NGC 3783 observed in 2000, 2001, and 2013. Most of the prominent absorption and emission features are labeled. The solid vertical lines in purple (blue) indicate the photoionized absorption (emission) features.
Current usage metrics show cumulative count of Article Views (full-text article views including HTML views, PDF and ePub downloads, according to the available data) and Abstracts Views on Vision4Press platform.
Data correspond to usage on the plateform after 2015. The current usage metrics is available 48-96 hours after online publication and is updated daily on week days.
Initial download of the metrics may take a while.