Fig. 9
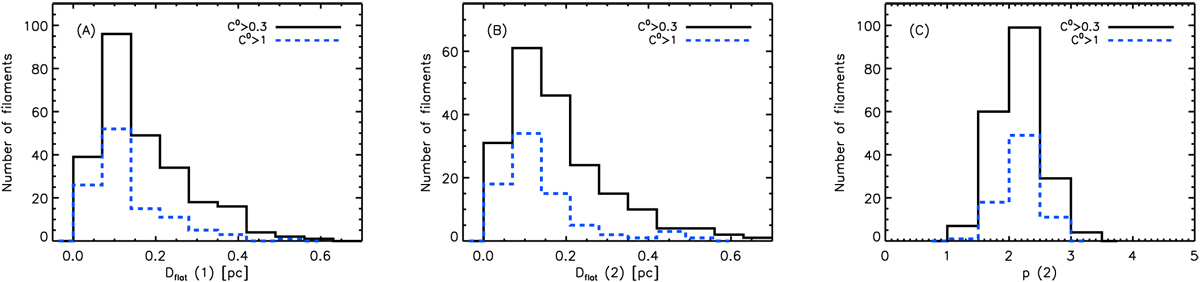
Results of Plummer fits to the median radial column density profiles of the filaments in the selected sample with contrasts C0 > 0.3 and C0 > 1. Panel A: distributions of flat inner diameters Dflat(1) obtained for a fixed value of the Plummer power-law index p = 2 for 260 filaments with C0 > 0.3 (black solid histogram) and 113 filaments with C0 > 1 (blue dashedhistogram). The median Dflat(1) values are 0.13 and 0.10 pc, and the equivalent standard deviations (estimated from scaling the measured IQRs) are 0.10 and 0.08 pc, for the subsets of filaments with C0 > 0.3 and C0 > 1, respectively. Panel B: distributions of Dflat(2) values obtained when p is left as a free parameter (i.e., fitting both Rflat and p) for 199 filaments with C0 > 0.3 and 79 filaments with C0 > 1, respectively. The median Dflat(2) values are 0.15 and 0.12 pc, and the equivalent standard deviations are 0.10 and 0.07 pc, for the subsets of filaments with C0 > 0.3 and C0 > 1, respectively. (NB: The total number of filaments for which reliable Plummer fits can be derived is lower when p and Rflat are fitted simultaneously than when the fit is performed by fixing p = 2.) Panel C: distribution of power-law index values p(2) corresponding to the Dflat(2) values in panel B. The median p(2) value is 2.2 for both subsets of filaments (with C0 > 0.3 and C0 > 1), and the equivalent standard deviations of the distributions are 0.4 and 0.3, respectively.
Current usage metrics show cumulative count of Article Views (full-text article views including HTML views, PDF and ePub downloads, according to the available data) and Abstracts Views on Vision4Press platform.
Data correspond to usage on the plateform after 2015. The current usage metrics is available 48-96 hours after online publication and is updated daily on week days.
Initial download of the metrics may take a while.