Fig. 8
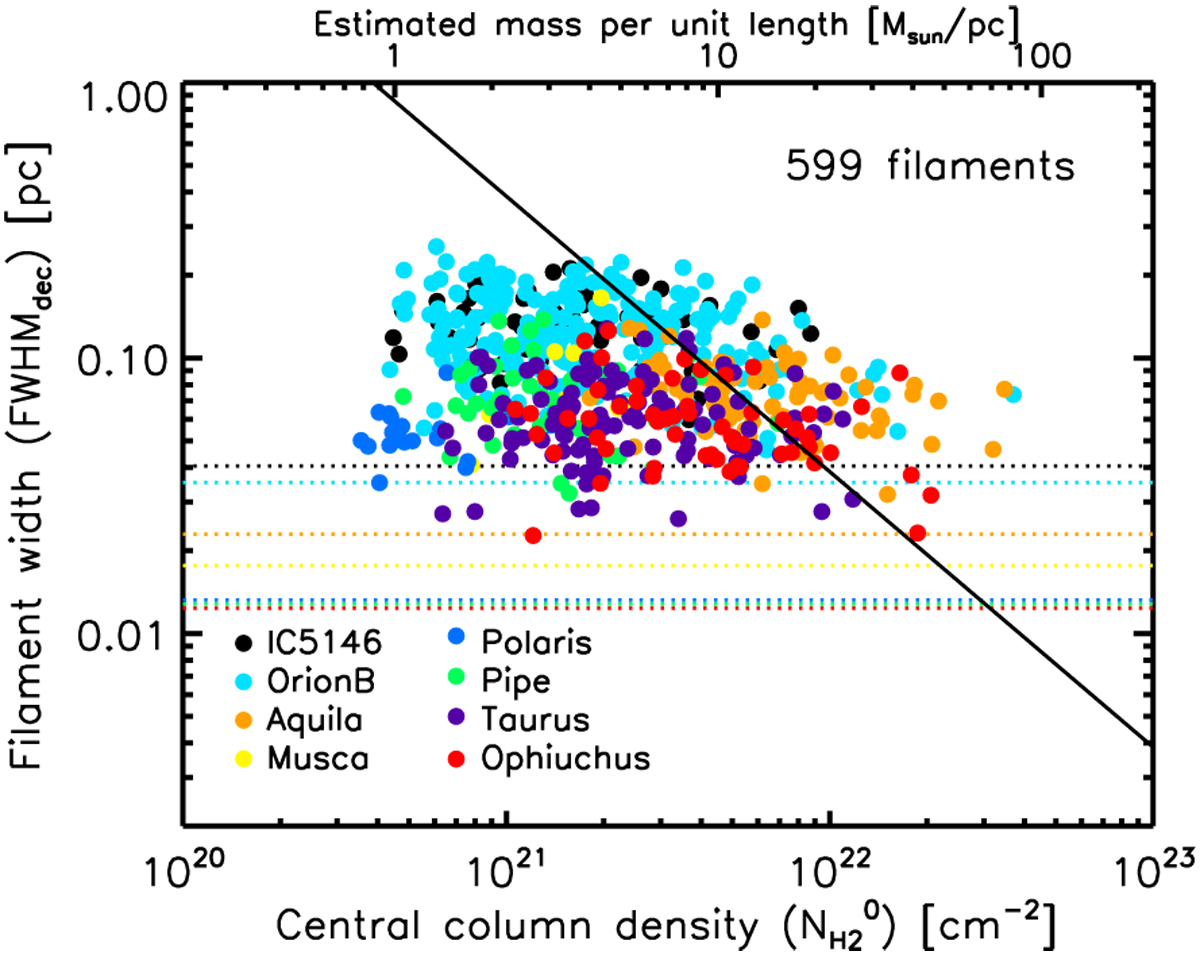
Deconvolved FWHM width against central column density ![]() for the selected sample of 599 filaments. The dotted horizontal lines mark the spatial resolutions of the column density maps used in the analysis for each field. The solid line running from top left to bottom right shows the central (thermal) Jeans length as a function of central column density [
for the selected sample of 599 filaments. The dotted horizontal lines mark the spatial resolutions of the column density maps used in the analysis for each field. The solid line running from top left to bottom right shows the central (thermal) Jeans length as a function of central column density [![]() ] for T = 10 K. The upper x-axis shows an approximate mass per unit length scale derive from the bottom x-axis scale as
] for T = 10 K. The upper x-axis shows an approximate mass per unit length scale derive from the bottom x-axis scale as ![]() for Wfil = 0.1 pc.
for Wfil = 0.1 pc.
Current usage metrics show cumulative count of Article Views (full-text article views including HTML views, PDF and ePub downloads, according to the available data) and Abstracts Views on Vision4Press platform.
Data correspond to usage on the plateform after 2015. The current usage metrics is available 48-96 hours after online publication and is updated daily on week days.
Initial download of the metrics may take a while.