Fig. 7
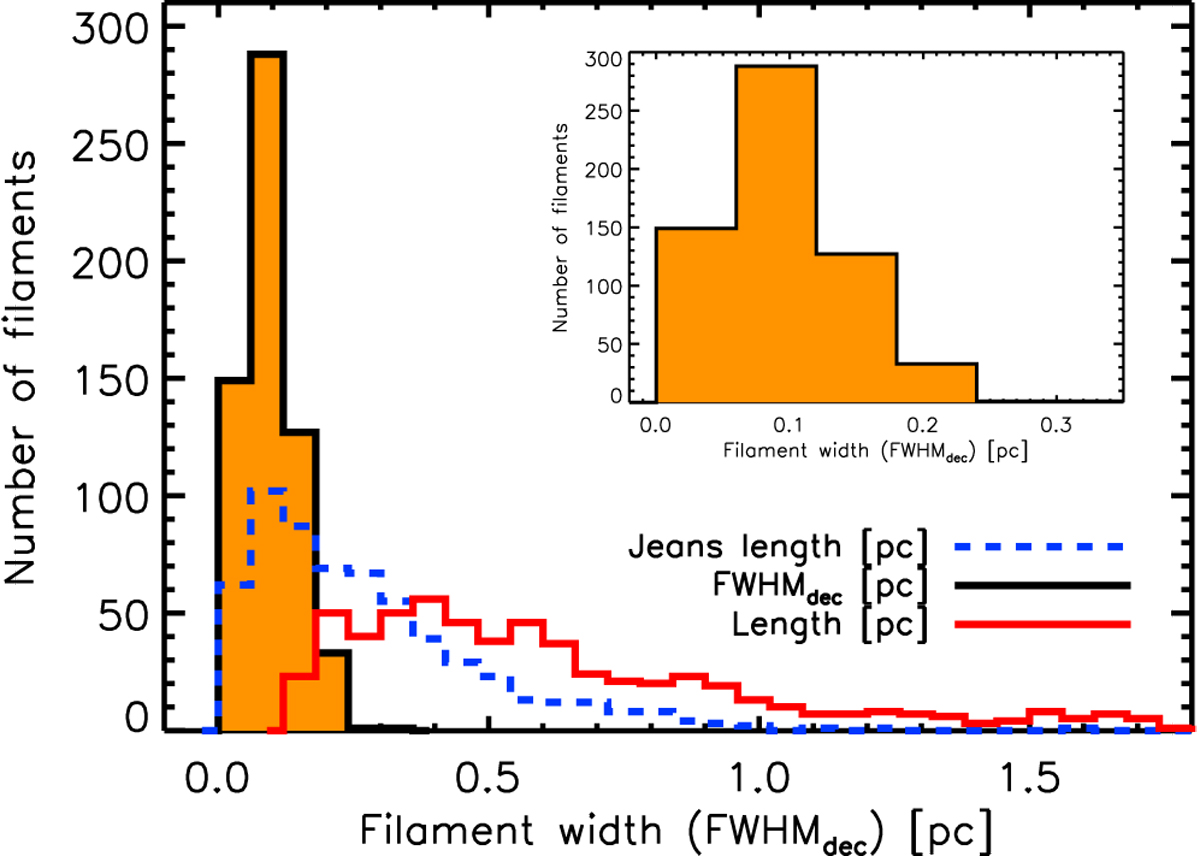
Distribution of deconvolved FWHMdec widths derived from Gaussian fits for the selected sample of 599 filaments (black solid histogram filled in orange). The same histogram is shown in the top right of the panel with a narrower x-axis range. This distribution has a mean of 0.10 pc, a standard deviation of 0.05 pc, a median of 0.09 pc, and an interquartile range of 0.07 pc. For comparison, the blue dashed histogram shows the distribution of central Jeans lengths corresponding to the central column densities of the filaments [![]() ] for a gas temperature of 10 K. The red histogram shows the distribution of filament lengths. The bin size of all three histograms is 0.06 pc. It can be seen that the distribution of filament widths is much narrower than the other two distributions.
] for a gas temperature of 10 K. The red histogram shows the distribution of filament lengths. The bin size of all three histograms is 0.06 pc. It can be seen that the distribution of filament widths is much narrower than the other two distributions.
Current usage metrics show cumulative count of Article Views (full-text article views including HTML views, PDF and ePub downloads, according to the available data) and Abstracts Views on Vision4Press platform.
Data correspond to usage on the plateform after 2015. The current usage metrics is available 48-96 hours after online publication and is updated daily on week days.
Initial download of the metrics may take a while.