Fig. 5
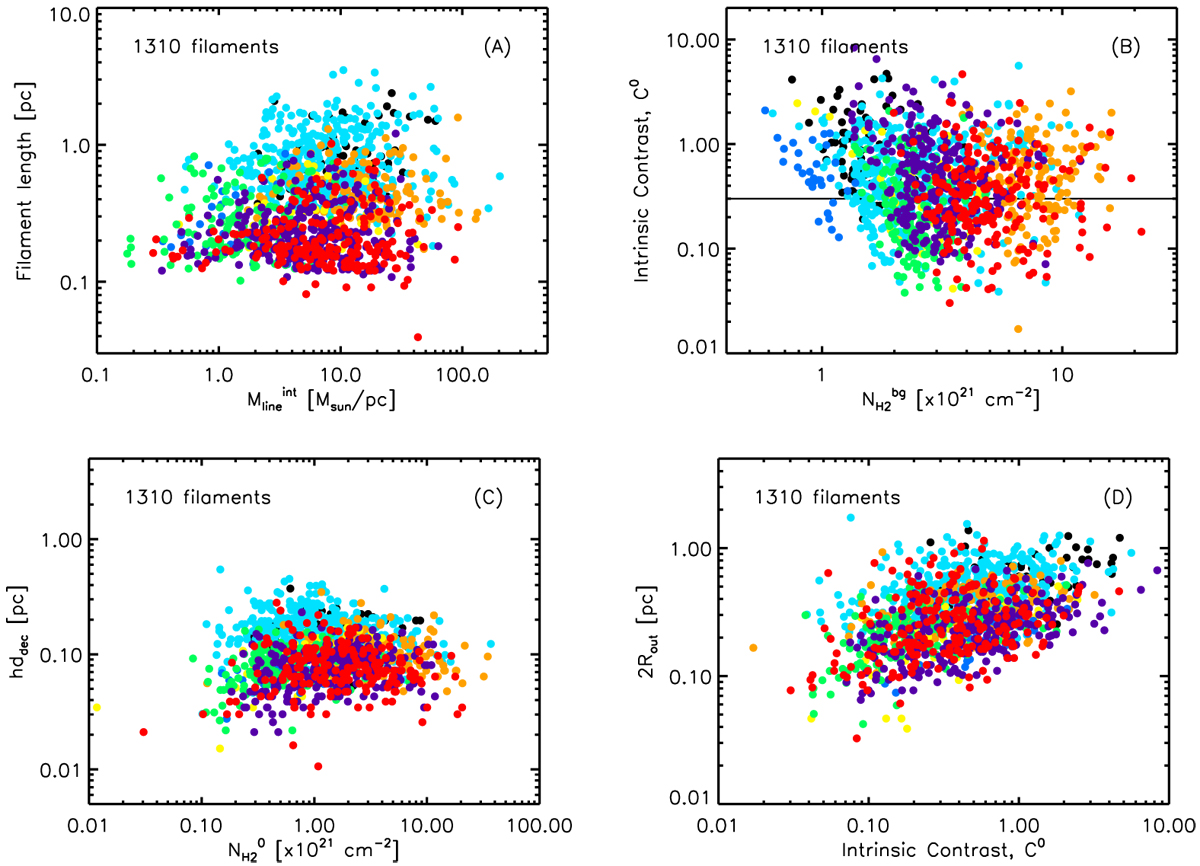
Plots of estimated length lfil against massper unit length ![]() (panel A), column density contrast C0 against background column density
(panel A), column density contrast C0 against background column density ![]() (panel B), deconvolved half-power diameter hddec
against
(panel B), deconvolved half-power diameter hddec
against ![]() (panel C), and outer diameter (2Rout) against C0, for the entire sample of 1310 extracted filaments (panel D). Panel B: horizontal line corresponds to
C0 = 0.3, the minimum contrast imposed as a selection criterion in Sect. 3.5. Panel c: distribution of measured
hddec values has a mean of 0.11 pc, a standard deviation of 0.06 pc, a median of 0.10 pc, and an interquartile range of 0.08 pc.
(panel C), and outer diameter (2Rout) against C0, for the entire sample of 1310 extracted filaments (panel D). Panel B: horizontal line corresponds to
C0 = 0.3, the minimum contrast imposed as a selection criterion in Sect. 3.5. Panel c: distribution of measured
hddec values has a mean of 0.11 pc, a standard deviation of 0.06 pc, a median of 0.10 pc, and an interquartile range of 0.08 pc.
Current usage metrics show cumulative count of Article Views (full-text article views including HTML views, PDF and ePub downloads, according to the available data) and Abstracts Views on Vision4Press platform.
Data correspond to usage on the plateform after 2015. The current usage metrics is available 48-96 hours after online publication and is updated daily on week days.
Initial download of the metrics may take a while.