Fig. 3
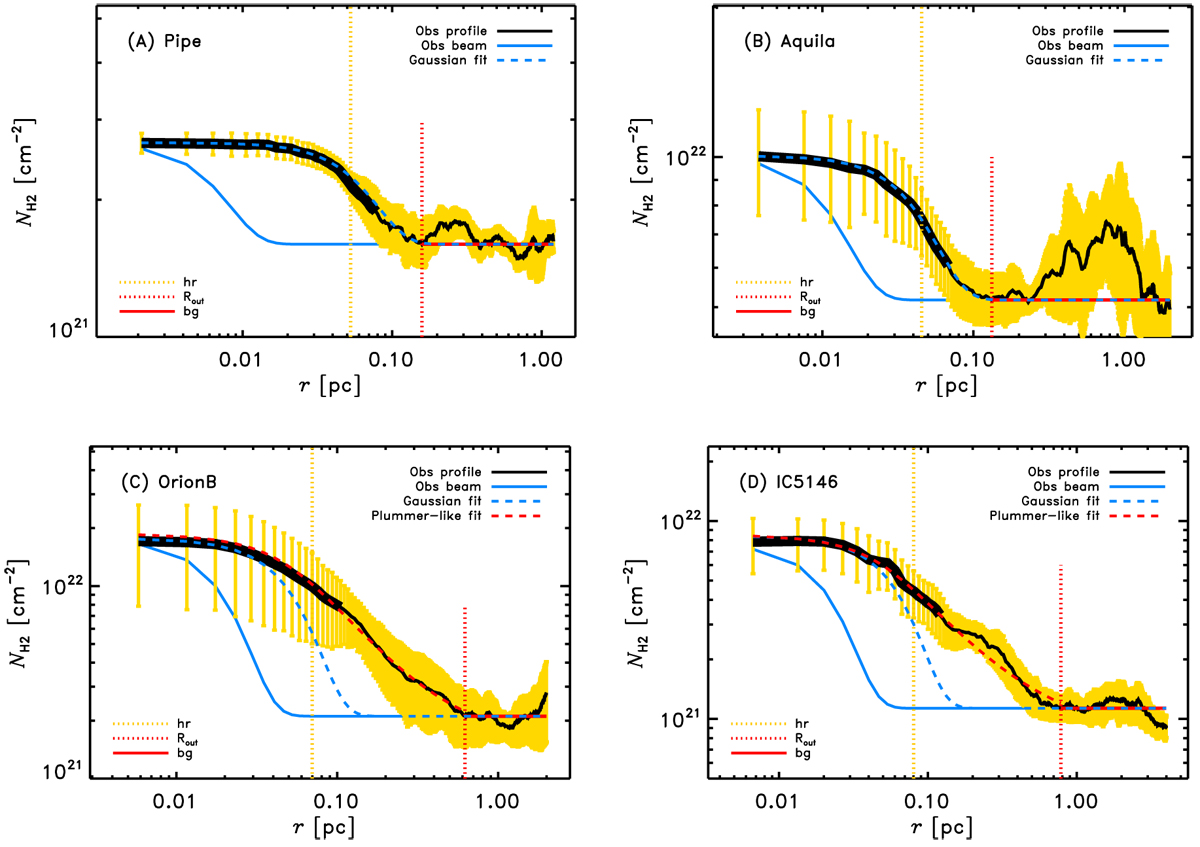
Radial column density profiles (in log–log format) observed perpendicular to, and averaged along, the crestsof four filaments in four different clouds. The cloud name is indicated at the top left of each panel. The blue and red dashed curves show the best Gaussian and Plummer fits, respectively (see Sect. 3.3). Panels A and B: observed profiles are Gaussian-like and the derived (hddec, FWHMdec) widths are (0.11 pc, 0.12 pc) and (0.09 pc, 0.09 pc), respectively. Panels C and D: inner parts of the profiles are well reproduced by Gaussian functions, but the outer parts show power-law wings, which are much better fitted with Plummer functions. The derived (hddec, FWHMdec, Dflat, and p) parametes are (0.14 pc, 0.10 pc, 0.09 pc, 2.2) and (0.16 pc, 0.11 pc, 0.08 pc, 2.2), for panels C and D, respectively. On each plot, the blue solid curve represents the effective beam resolution of the column density map (18.2′′). The half-power radius hr, outer radius Rout, and background column density (bg), are also indicated (see legend on the bottom left of the panels and Sect. 3.2). The black thick section of each profile indicates the fitting range of the Gaussian fits (i.e., r ≤ 1.5hr). The Plummer fits were performed for r ≤ Rout. The yellow area/error bars correspond to the median absolute deviations [mad(r)] of the distribution of independent cuts taken perpendicular to the filament crest (see Sect. 3.1).
Current usage metrics show cumulative count of Article Views (full-text article views including HTML views, PDF and ePub downloads, according to the available data) and Abstracts Views on Vision4Press platform.
Data correspond to usage on the plateform after 2015. The current usage metrics is available 48-96 hours after online publication and is updated daily on week days.
Initial download of the metrics may take a while.