Fig. C.1
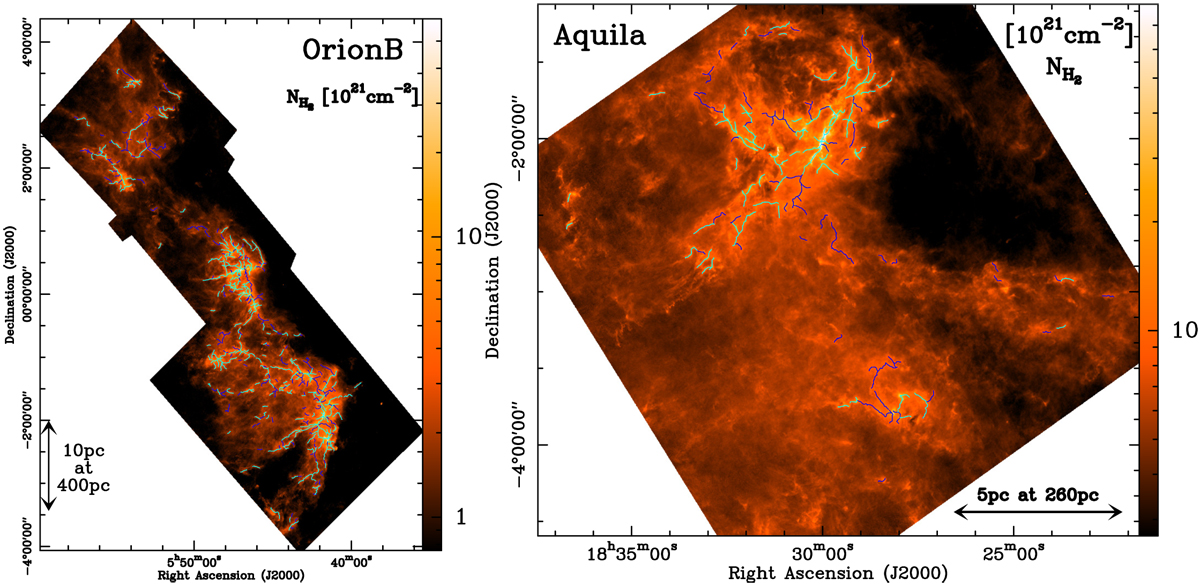
Herschel column density maps of the Orion B field (left panel – Könyves et al. 2018) and Aquila field (right panel – Könyves et al. 2015) analyzed in this paper, as derived from HGBS data (http://gouldbelt-herschel.cea.fr/archives, André et al. 2010). The effective HPBW resolution is 18.′′ 2. The crests of the filamentary structures traced in the two clouds using DisPerSE (see Sect. 2.2) are overlaid as solid curves. The cyan curves trace the filament crests of the selected sample, and the dark blue curves trace the additional filament crests in the extended sample (cf. Sect. 3.5). See Table 2 for the absolute values of the persistence and robustness thresholds of the DisPerSE runs, as well as the number of extracted filaments in each field.
Current usage metrics show cumulative count of Article Views (full-text article views including HTML views, PDF and ePub downloads, according to the available data) and Abstracts Views on Vision4Press platform.
Data correspond to usage on the plateform after 2015. The current usage metrics is available 48-96 hours after online publication and is updated daily on week days.
Initial download of the metrics may take a while.