Fig. B.3
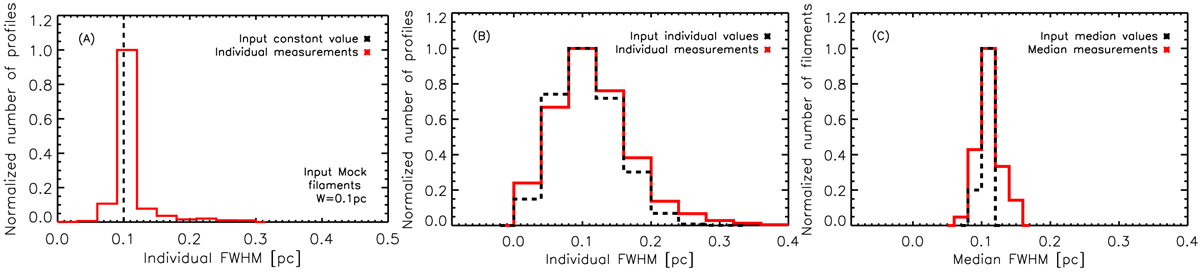
Histograms of FWHM widths derived from Gaussian fits to the column density profiles of Gaussian-shaped synthetic filaments. The distributions of input and measured FWHM widths are displayed in black and red, respectively. The range radii used for the Gaussian fits was [0, 1.5hr]. Panel a: distribution of individual FWHM widths measured along and on either side of the filament crests for input FWHM width (W = 0.1 pc) constant along the filament length (same as Fig. B.2A). Panel b: distribution of individual FWHM widths measured along and on either side of the filament crests, for input individual FWHM widths with a Gaussian distribution centered at 0.1 pc with a standard deviation of 0.05 pc. Panel c: distribution of median FWHM widths “averaged” over each filament crest for the same input FWHM distribution as in panel B.
Current usage metrics show cumulative count of Article Views (full-text article views including HTML views, PDF and ePub downloads, according to the available data) and Abstracts Views on Vision4Press platform.
Data correspond to usage on the plateform after 2015. The current usage metrics is available 48-96 hours after online publication and is updated daily on week days.
Initial download of the metrics may take a while.