Fig. B.2
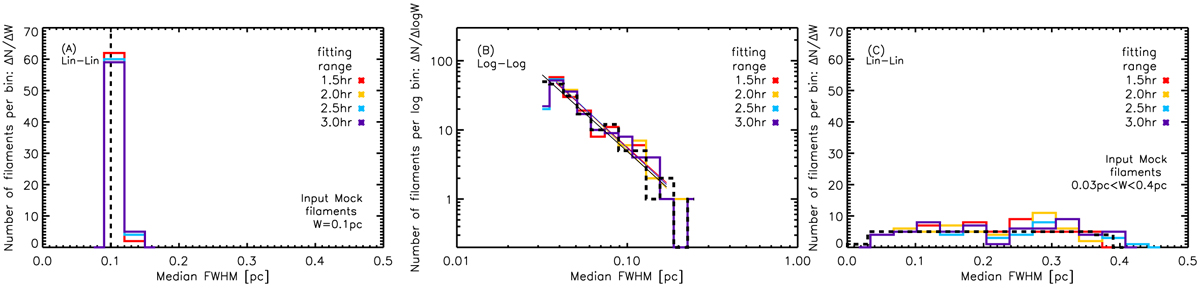
Histograms of FWHM widths derived from Gaussian fitting to the radial column density profiles of synthetic filaments with Gaussian input profiles and fixed input FWHM width (W = 0.1 pc; (panel a), a power law distribution of FWHM widths between 0.03 and 0.25 pc (panel b), and a flat input distribution of FWHM widths between 0.03 and 0.4 pc (panel c). The input FWHM width distributions are shown with the black dashed lines on all panels. Results are presented for four choices of the fitting range (1.5hr, 2.0hr, 2.5hr, 3.0hr), color codedas shown on the right hand side of each plot (cf. Sect. 3.3.3). Note how the measured distributions of filament widths are almost independent of the fitting range.
Current usage metrics show cumulative count of Article Views (full-text article views including HTML views, PDF and ePub downloads, according to the available data) and Abstracts Views on Vision4Press platform.
Data correspond to usage on the plateform after 2015. The current usage metrics is available 48-96 hours after online publication and is updated daily on week days.
Initial download of the metrics may take a while.